Evaluation of physical and functional protein-protein interaction prediction methods for detecting biological pathways
- PMID: 23349851
- PMCID: PMC3547882
- DOI: 10.1371/journal.pone.0054325
Evaluation of physical and functional protein-protein interaction prediction methods for detecting biological pathways
Abstract
Background: Cellular activities are governed by the physical and the functional interactions among several proteins involved in various biological pathways. With the availability of sequenced genomes and high-throughput experimental data one can identify genome-wide protein-protein interactions using various computational techniques. Comparative assessments of these techniques in predicting protein interactions have been frequently reported in the literature but not their ability to elucidate a particular biological pathway.
Methods: Towards the goal of understanding the prediction capabilities of interactions among the specific biological pathway proteins, we report the analyses of 14 biological pathways of Escherichia coli catalogued in KEGG database using five protein-protein functional linkage prediction methods. These methods are phylogenetic profiling, gene neighborhood, co-presence of orthologous genes in the same gene clusters, a mirrortree variant, and expression similarity.
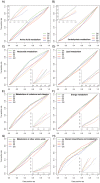
Conclusions: Our results reveal that the prediction of metabolic pathway protein interactions continues to be a challenging task for all methods which possibly reflect flexible/independent evolutionary histories of these proteins. These methods have predicted functional associations of proteins involved in amino acids, nucleotide, glycans and vitamins & co-factors pathways slightly better than the random performance on carbohydrate, lipid and energy metabolism. We also make similar observations for interactions involved among the environmental information processing proteins. On the contrary, genetic information processing or specialized processes such as motility related protein-protein linkages that occur in the subset of organisms are predicted with comparable accuracy. Metabolic pathways are best predicted by using neighborhood of orthologous genes whereas phyletic pattern is good enough to reconstruct central dogma pathway protein interactions. We have also shown that the effective use of a particular prediction method depends on the pathway under investigation. In case one is not focused on specific pathway, gene expression similarity method is the best option.
Conflict of interest statement
Figures


Similar articles
-
Effect of reference genome selection on the performance of computational methods for genome-wide protein-protein interaction prediction.PLoS One. 2012;7(7):e42057. doi: 10.1371/journal.pone.0042057. Epub 2012 Jul 26. PLoS One. 2012. PMID: 22844541 Free PMC article.
-
Dynamic changes in protein functional linkage networks revealed by integration with gene expression data.PLoS Comput Biol. 2008 Nov;4(11):e1000237. doi: 10.1371/journal.pcbi.1000237. Epub 2008 Nov 28. PLoS Comput Biol. 2008. PMID: 19043542 Free PMC article.
-
Inferring genome-wide functional linkages in E. coli by combining improved genome context methods: comparison with high-throughput experimental data.Genome Res. 2007 Apr;17(4):527-35. doi: 10.1101/gr.5900607. Epub 2007 Mar 5. Genome Res. 2007. PMID: 17339371 Free PMC article.
-
Towards multidimensional genome annotation.Nat Rev Genet. 2006 Feb;7(2):130-41. doi: 10.1038/nrg1769. Nat Rev Genet. 2006. PMID: 16418748 Review.
-
Computational and experimental approaches to chart the Escherichia coli cell-envelope-associated proteome and interactome.FEMS Microbiol Rev. 2009 Jan;33(1):66-97. doi: 10.1111/j.1574-6976.2008.00141.x. Epub 2008 Nov 27. FEMS Microbiol Rev. 2009. PMID: 19054114 Free PMC article. Review.
Cited by
-
Computational Methods and Deep Learning for Elucidating Protein Interaction Networks.Methods Mol Biol. 2023;2553:285-323. doi: 10.1007/978-1-0716-2617-7_15. Methods Mol Biol. 2023. PMID: 36227550
-
Search, Retrieve, Visualize, and Analyze Protein-Protein Interactions from Multiple Databases: A Guide for Experimental Biologists.Methods Mol Biol. 2023;2690:429-443. doi: 10.1007/978-1-0716-3327-4_33. Methods Mol Biol. 2023. PMID: 37450164
-
PDZ Domains Across the Microbial World: Molecular Link to the Proteases, Stress Response, and Protein Synthesis.Genome Biol Evol. 2019 Mar 1;11(3):644-659. doi: 10.1093/gbe/evz023. Genome Biol Evol. 2019. PMID: 30698789 Free PMC article.
-
Inter-protein residue covariation information unravels physically interacting protein dimers.BMC Bioinformatics. 2020 Dec 17;21(1):584. doi: 10.1186/s12859-020-03930-7. BMC Bioinformatics. 2020. PMID: 33334319 Free PMC article.
-
Structural bioinformatics of the interactome.Annu Rev Biophys. 2014;43:193-210. doi: 10.1146/annurev-biophys-051013-022726. Annu Rev Biophys. 2014. PMID: 24895853 Free PMC article. Review.
References
-
- Marcotte EM (2000) Computational genetics: finding protein function by nonhomology methods. Curr Opin Struct Biol 10: 359–365. - PubMed
-
- Butland G, Peregrin-Alvarez JM, Li J, Yang W, Yang X, et al. (2005) Interaction network containing conserved and essential protein complexes in Escherichia coli. Nature 433: 531–537. - PubMed
Publication types
MeSH terms
Substances
LinkOut - more resources
Full Text Sources
Other Literature Sources

