

Local adaptation to altitude underlies divergent thermal physiology in tropical killifishes of the genus Aphyosemion
- PMID: 23349857
- PMCID: PMC3551936
- DOI: 10.1371/journal.pone.0054345
Local adaptation to altitude underlies divergent thermal physiology in tropical killifishes of the genus Aphyosemion
Abstract
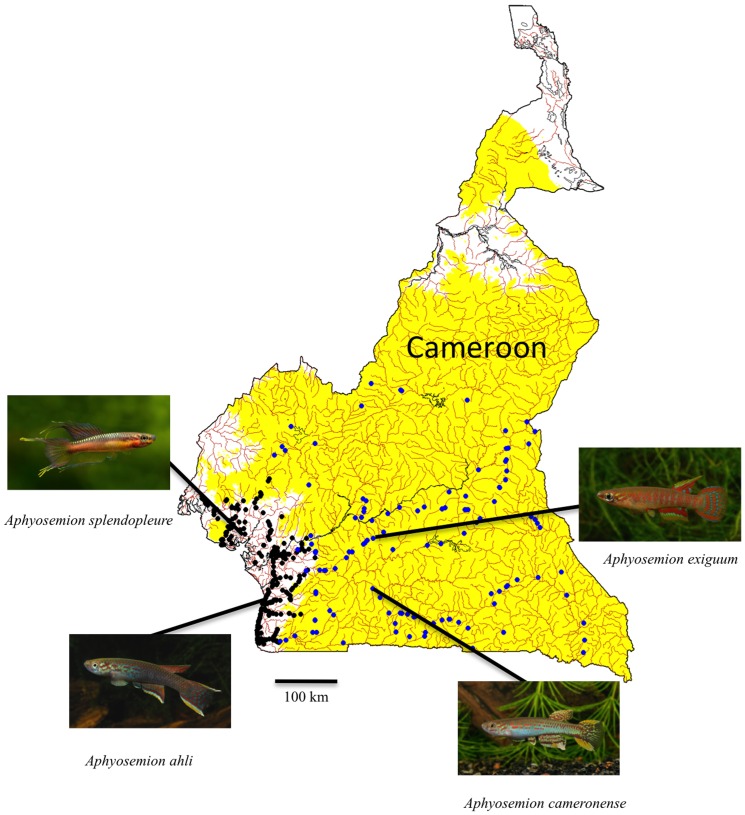
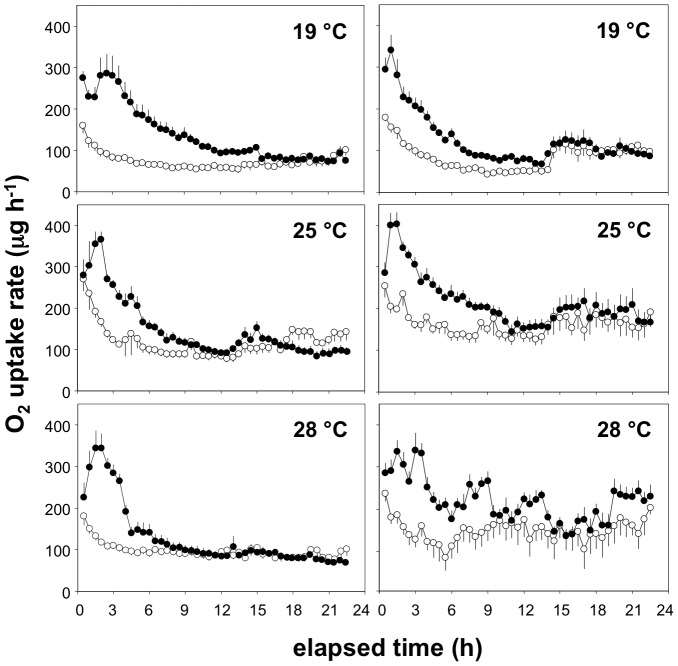
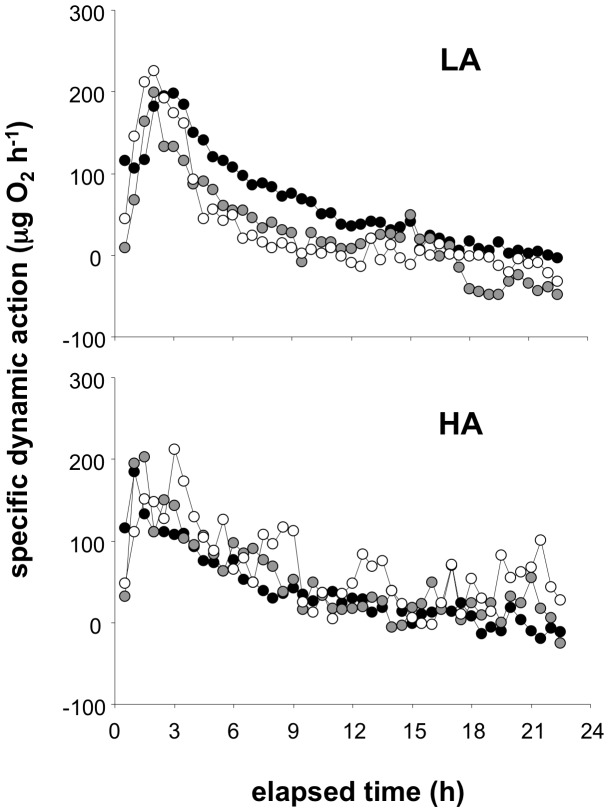
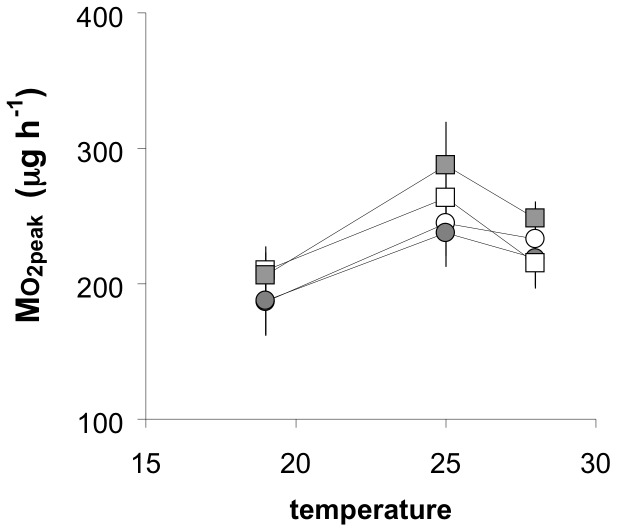
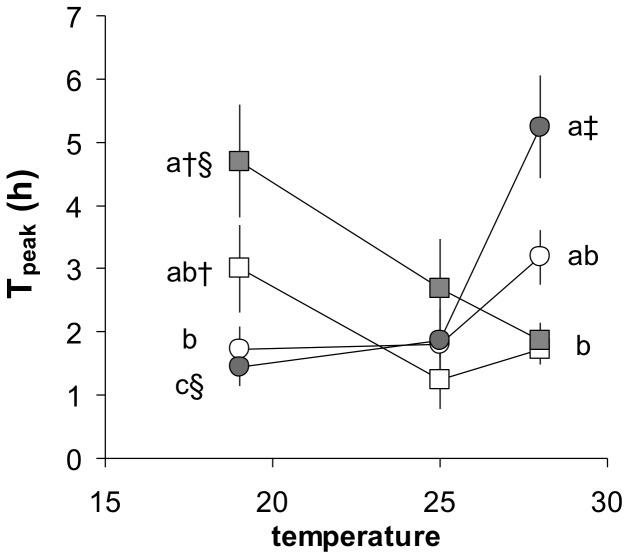
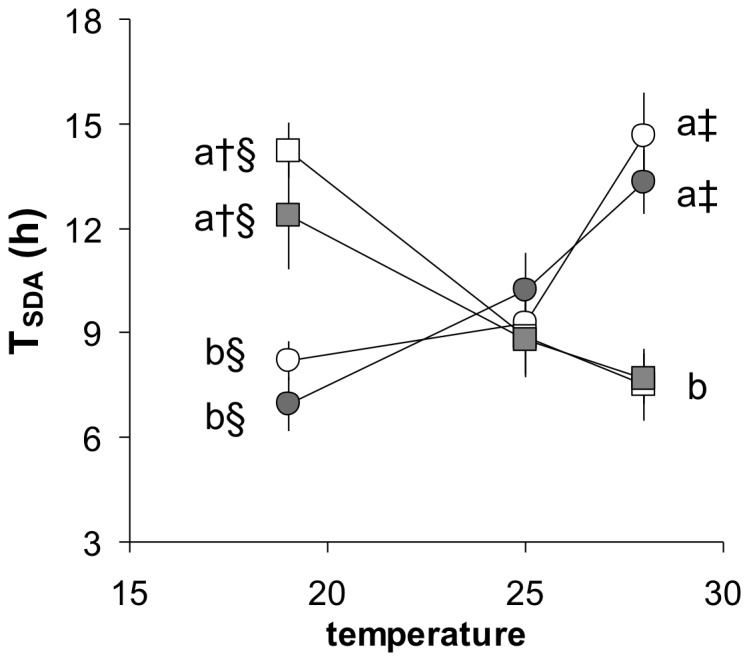
In watersheds of equatorial West Africa, monophyletic groups of killifish species (genus Aphyosemion) occur in discrete altitudinal ranges, low altitude species (LA, sea level to ∼350 m) or high altitude species (HA, 350 to 900 m). We investigated the hypothesis that local adaptation to altitude by the LA and HA species would be revealed as divergent effects of temperature on their physiological energetics. Two species from each group (mass ∼350 mg) were acclimated to 19, 25 and 28°C, with 19 and 28°C estimated to be outside the thermal envelope for LA or HA, respectively, in the wild. Wild-caught animals (F0 generation) were compared with animals raised in captivity at 25°C (F1 generation) to investigate the contribution of adaptation versus plasticity. Temperature significantly increased routine metabolic rate in all groups and generations. However, LA and HA species differed in the effects of temperature on their ability to process a meal. At 25°C, the specific dynamic action (SDA) response was completed within 8 h in all groups, but acclimation to temperatures beyond the thermal envelope caused profound declines in SDA performance. At 19°C, the LA required ∼14 h to complete the SDA, whereas the HA required only ∼7 h. The opposite effect was observed at 28°C. This effect was evident in both F0 and F1. Reaction norms for effects of temperature on SDA therefore revealed a trade-off, with superior performance at warmer temperatures by LA being associated with inferior performance at cooler temperatures, and vice-versa in HA. The data indicate that divergent physiological responses to temperature in the LA and HA species reflect local adaptation to the thermal regime in their habitat, and that local adaptation to one thermal environment trades off against performance in another.
Conflict of interest statement
Figures
Similar articles
-
The metabolism and swimming performance of sheepshead minnows (Cyprinodon variegatus) following thermal acclimation or acute thermal exposure.J Comp Physiol B. 2020 Sep;190(5):557-568. doi: 10.1007/s00360-020-01293-2. Epub 2020 Jul 15. J Comp Physiol B. 2020. PMID: 32671461
-
An appetite for invasion: digestive physiology, thermal performance and food intake in lionfish (Pterois spp.).J Exp Biol. 2019 Oct 10;222(Pt 19):jeb209437. doi: 10.1242/jeb.209437. J Exp Biol. 2019. PMID: 31527176
-
Acclimation temperature alters the relationship between growth and swimming performance among juvenile common carp (Cyprinus carpio).Comp Biochem Physiol A Mol Integr Physiol. 2016 Sep;199:111-119. doi: 10.1016/j.cbpa.2016.06.011. Epub 2016 Jun 13. Comp Biochem Physiol A Mol Integr Physiol. 2016. PMID: 27312325
-
Cross-Adaptation: Heat and Cold Adaptation to Improve Physiological and Cellular Responses to Hypoxia.Sports Med. 2017 Sep;47(9):1751-1768. doi: 10.1007/s40279-017-0717-z. Sports Med. 2017. PMID: 28389828 Free PMC article. Review.
-
Thermal biology of sea snakes and sea kraits.Integr Comp Biol. 2012 Aug;52(2):257-73. doi: 10.1093/icb/ics080. Epub 2012 Jun 4. Integr Comp Biol. 2012. PMID: 22669175 Review.
Cited by
-
Widespread use of emersion and cutaneous ammonia excretion in Aplocheiloid killifishes.Proc Biol Sci. 2018 Aug 15;285(1884):20181496. doi: 10.1098/rspb.2018.1496. Proc Biol Sci. 2018. PMID: 30111602 Free PMC article.
-
Effects of temperature on specific dynamic action in Atlantic cod Gadus morhua.Fish Physiol Biochem. 2015 Feb;41(1):41-50. doi: 10.1007/s10695-014-0004-y. Epub 2014 Oct 25. Fish Physiol Biochem. 2015. PMID: 25343877
-
Intraspecific variation in aerobic and anaerobic locomotion: gilthead sea bream (Sparus aurata) and Trinidadian guppy (Poecilia reticulata) do not exhibit a trade-off between maximum sustained swimming speed and minimum cost of transport.Front Physiol. 2015 Feb 17;6:43. doi: 10.3389/fphys.2015.00043. eCollection 2015. Front Physiol. 2015. PMID: 25741285 Free PMC article.
-
Variation in spawning time promotes genetic variability in population responses to environmental change in a marine fish.Conserv Physiol. 2015 Jul 2;3(1):cov027. doi: 10.1093/conphys/cov027. eCollection 2015. Conserv Physiol. 2015. PMID: 27293712 Free PMC article.
-
An unusually high upper thermal acclimation potential for rainbow trout.Conserv Physiol. 2022 Jan 15;10(1):coab101. doi: 10.1093/conphys/coab101. eCollection 2022. Conserv Physiol. 2022. PMID: 35492409 Free PMC article.
References
-
- Fry FEJ (1971) The Effect of Environmental Factors on the Physiology of Fish. In: Hoar WS, Randall DJ, editors. Fish Physiology Volume 6. New York: Academic Press. pp. 1–98.
-
- Powers DA, Schulte PM (1998) Evolutionary Adaptations of Gene Structure and Expression in Natural Populations in Relation to a Changing Environment: A Multidisciplinary Approach to Address the Million-Year Saga of a Small Fish. Journal of Experimental Zoology 282: 71–94. - PubMed
-
- Eliason EJ, Clark TD, Hague MJ, Hanson LM, Gallagher ZS, et al. (2011) Differences in thermal tolerance among sockeye salmon populations. Science (New York, NY) 332: 109–112 Available: http://www.ncbi.nlm.nih.gov/pubmed/21454790. Accessed 9 March 2012. - PubMed
-
- Fangue NA, Podrabsky JE, Crawshaw LI, Schulte PM (2009) Countergradient variation in temperature preference in populations of killifish Fundulus heteroclitus. Physiological and biochemical zoology: PBZ 82: 776–786 Available: http://www.ncbi.nlm.nih.gov/pubmed/19732025. Accessed 10 May 2012. - PubMed
-
- Fangue NA, Mandic M, Richards JG, Schulte PM (2008) Swimming performance and energetics as a function of temperature in killifish Fundulus heteroclitus. Physiological and biochemical zoology: PBZ 81: 389–401 Available: http://www.ncbi.nlm.nih.gov/pubmed/18513151. Accessed 12 March 2012. - PubMed
Publication types
MeSH terms
LinkOut - more resources
Full Text Sources
Other Literature Sources
