

Exposure to extremely low-frequency electromagnetic fields modulates Na+ currents in rat cerebellar granule cells through increase of AA/PGE2 and EP receptor-mediated cAMP/PKA pathway
- PMID: 23349866
- PMCID: PMC3551899
- DOI: 10.1371/journal.pone.0054376
Exposure to extremely low-frequency electromagnetic fields modulates Na+ currents in rat cerebellar granule cells through increase of AA/PGE2 and EP receptor-mediated cAMP/PKA pathway
Abstract
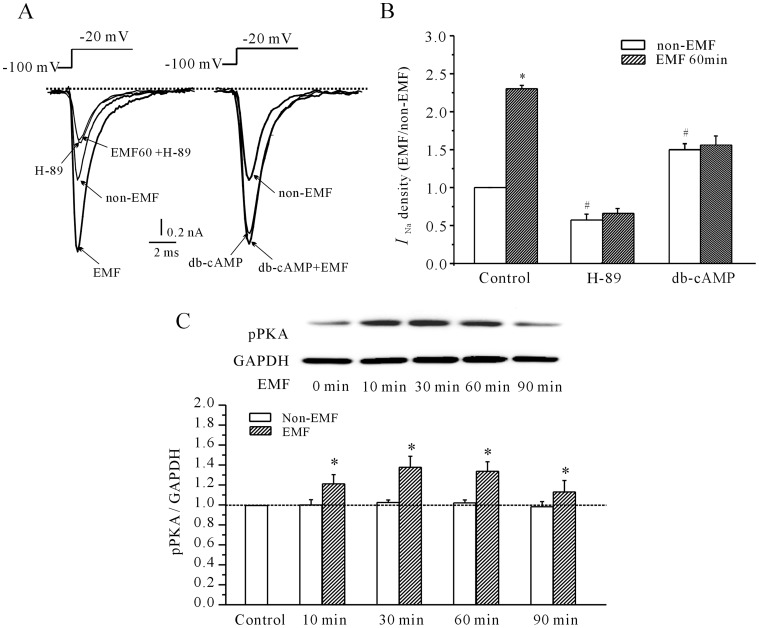
Although the modulation of Ca(2+) channel activity by extremely low-frequency electromagnetic fields (ELF-EMF) has been studied previously, few reports have addressed the effects of such fields on the activity of voltage-activated Na(+) channels (Na(v)). Here, we investigated the effects of ELF-EMF on Na(v) activity in rat cerebellar granule cells (GCs). Our results reveal that exposing cerebellar GCs to ELF-EMF for 10-60 min significantly increased Na(v) currents (I(Na)) by 30-125% in a time- and intensity-dependent manner. The Na(v) channel steady-state activation curve, but not the steady-state inactivation curve, was significantly shifted (by 5.2 mV) towards hyperpolarization by ELF-EMF stimulation. This phenomenon is similar to the effect of intracellular application of arachidonic acid (AA) and prostaglandin E(2) (PGE(2)) on I(Na) in cerebellar GCs. Increases in intracellular AA, PGE(2) and phosphorylated PKA levels in cerebellar GCs were observed following ELF-EMF exposure. Western blottings indicated that the Na(V) 1.2 protein on the cerebellar GCs membrane was increased, the total expression levels of Na(V) 1.2 protein were not affected after exposure to ELF-EMF. Cyclooxygenase inhibitors and PGE(2) receptor (EP) antagonists were able to eliminate this ELF-EMF-induced increase in phosphorylated PKA and I(Na). In addition, ELF-EMF exposure significantly enhanced the activity of PLA(2) in cerebellar GCs but did not affect COX-1 or COX-2 activity. Together, these data demonstrate for the first time that neuronal I(Na) is significantly increased by ELF-EMF exposure via a cPLA2 AA PGE(2) EP receptors PKA signaling pathway.
Conflict of interest statement
Figures


Similar articles
-
Melatonin protects rat cerebellar granule cells against electromagnetic field-induced increases in Na(+) currents through intracellular Ca(2+) release.J Cell Mol Med. 2014 Jun;18(6):1060-70. doi: 10.1111/jcmm.12250. Epub 2014 Feb 18. J Cell Mol Med. 2014. PMID: 24548607 Free PMC article.
-
Arachidonic acid modulates Na+ currents by non-metabolic and metabolic pathways in rat cerebellar granule cells.Biochem J. 2011 Aug 15;438(1):203-15. doi: 10.1042/BJ20110569. Biochem J. 2011. PMID: 21564022
-
Exposure to extremely low-frequency electromagnetic fields inhibits T-type calcium channels via AA/LTE4 signaling pathway.Cell Calcium. 2014 Jan;55(1):48-58. doi: 10.1016/j.ceca.2013.11.002. Epub 2013 Dec 5. Cell Calcium. 2014. PMID: 24360572
-
Extremely low frequency electromagnetic fields as effectors of cellular responses in vitro: possible immune cell activation.J Cell Biochem. 2004 Sep 1;93(1):83-92. doi: 10.1002/jcb.20198. J Cell Biochem. 2004. PMID: 15352165 Review.
-
Insights in the biology of extremely low-frequency magnetic fields exposure on human health.Mol Biol Rep. 2020 Jul;47(7):5621-5633. doi: 10.1007/s11033-020-05563-8. Epub 2020 Jun 8. Mol Biol Rep. 2020. PMID: 32515000 Review.
Cited by
-
Efficient generation of brain organoids using magnetized gold nanoparticles.Sci Rep. 2023 Dec 1;13(1):21240. doi: 10.1038/s41598-023-48655-8. Sci Rep. 2023. PMID: 38040919 Free PMC article.
-
cAMP/PKA Pathways and S56 Phosphorylation Are Involved in AA/PGE2-Induced Increases in rNaV1.4 Current.PLoS One. 2015 Oct 20;10(10):e0140715. doi: 10.1371/journal.pone.0140715. eCollection 2015. PLoS One. 2015. PMID: 26485043 Free PMC article.
-
Improvement of spatial memory disorder and hippocampal damage by exposure to electromagnetic fields in an Alzheimer's disease rat model.PLoS One. 2015 May 15;10(5):e0126963. doi: 10.1371/journal.pone.0126963. eCollection 2015. PLoS One. 2015. PMID: 25978363 Free PMC article.
-
Exposure to 50 Hz magnetic field modulates GABAA currents in cerebellar granule neurons through an EP receptor-mediated PKC pathway.J Cell Mol Med. 2015 Oct;19(10):2413-22. doi: 10.1111/jcmm.12626. Epub 2015 Jul 14. J Cell Mol Med. 2015. PMID: 26176998 Free PMC article.
-
Protective effects of melatonin and omega-3 on the hippocampus and the cerebellum of adult Wistar albino rats exposed to electromagnetic fields.J Microsc Ultrastruct. 2017 Oct-Dec;5(4):230-241. doi: 10.1016/j.jmau.2017.05.006. Epub 2017 Jun 1. J Microsc Ultrastruct. 2017. PMID: 30023259 Free PMC article.
References
-
- Piacentini R, Ripoli C, Mezzogori D, Azzena GB, Grassi C (2008) Extremely low-frequency electromagnetic fields promote in vitro neurogenesis via upregulation of Ca(v)1-channel activity. J Cell Physiol 215: 129–139. - PubMed
-
- Dibirdik I, Kristupaitis D, Kurosaki T, Tuel-Ahlgren L, Chu A, et al. (1998) Stimulation of Src family protein-tyrosine kinases as a proximal and mandatory step for SYK kinase-dependent phospholipase Cgamma2 activation in lymphoma B cells exposed to low energy electromagnetic fields. J Biol Chem 273: 4035–4039. - PubMed
Publication types
MeSH terms
Substances
LinkOut - more resources
Full Text Sources
Other Literature Sources
Medical
Research Materials
Miscellaneous
