. 2013;8(1):e54562.
doi: 10.1371/journal.pone.0054562. Epub 2013 Jan 17.

Distinct profiles of effector cytokines mark the different phases of Crohn's disease

Affiliations

Distinct profiles of effector cytokines mark the different phases of Crohn's disease

Francesca Zorzi et al. PLoS One. 2013.

Abstract

Objective: Crohn's Disease (CD)-associated inflammation is supposed to be driven by T helper (Th)1/Th17 cell-derived cytokines, even though there is evidence that the mucosal profile of cytokine may vary with the evolution of the disease. We aimed at comparing the pattern of effector cytokines in early and established lesions of CD.

Design: Mucosal samples were taken from the neo-terminal ileum of CD patients undergoing ileocolonic resection, with (early lesions) or without post-operative recurrence, and terminal ileum of CD patients with long-standing disease undergoing intestinal resection (established lesions). Inflammatory cell infiltrate was examined by immunofluorescence and cytokine expression was analysed by real-time PCR, flow-cytometry and ELISA.

Results: Before the appearance of endoscopic lesions, the mucosa of the neo-terminal ileum contained high number of T cells and macrophages, elevated levels of Th1-related cytokines and TNF-α and slightly increased IL-17A expression. Transition from this stage to endoscopic recurrence was marked by abundance of Th1 cytokines, marked increase in IL-17A, and induction of IL-6 and IL-23, two cytokines involved in the control of Th17 cell responses. In samples with established lesions, there was a mixed Th1/Th17 response with no TNF-α induction. Expression of IL-4 and IL-5 was up-regulated in both early and established lesions even though the fraction of IL-4-producing cells was lower than that of cells producing either interferon-γ or IL-17A.

Conclusions: Distinct mucosal profiles of cytokines are produced during the different phases of CD. A better understanding of the cytokines temporally regulated in CD tissue could help optimize therapeutic interventions in CD.


Conflict of interest statement

Competing Interests: The authors state that this work was supported by “Fondazione Umberto Di Mario Onlus” (Rome, Italy) and Giuliani SpA, Milan, Italy. This does not alter the authors‚ adherence to all PLOS ONE policies on sharing data and materials.

Figures

Figure 1
Figure 1. CD3 and CD68 positive cells accumulate in the neo-terminal ileum of Crohn’s disease patients.
Representative immunofluorescence pictures of ileal sections of 1 CD patient with no evidence of endoscopic recurrence (i0), 1 CD patient with severe endoscopic recurrence (i4), 1 CD patient with established (late) lesion and 1normal control and stained with CD3+/DAPI (A) and CD68+/DAPI (B). Original magnification 100x. Insets in the left images show CD3 positive cells (A) and CD68 positive cells (B) at higher magnification (200x). C–D. Quantification of CD3+ and CD68+ cells in intestinal mucosa of 5 CD patients with no endoscopic recurrence (i0–i1), 5 CD patients with endoscopic recurrence (i2–i4), 5 CD patients with established lesions and 5 normal controls. Data are presented as mean values of positive cells per high power field ± SD of 5 independent experiments in which 5 sections per group were analyzed.
Figure 2
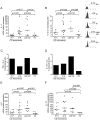
Figure 2. IFN-γ and IL-21 are up-regulated in the initial phase of CD inflammation.
Transcripts for IFN-γ (A) and IL-21 (C) were analysed in ileal samples taken from CD patients with no endoscopic recurrence (i0–i1), CD patients with endoscopic recurrence (i2–i4), CD patients with established/late lesions and normal controls by real-time PCR and normalized to β-actin. Data indicate individual values of cytokines in single biopsies and horizontal bars represent the median value. B–D. Flow cytometry analysis of IFN-γ- and IL-21-producing cells in CD3+LPMC isolated from CD patients with no endoscopic recurrence (i0–i1), CD patients with endoscopic recurrence (i2–i4), CD patients with established/late lesions and normal controls. LPMC were gated on CD3+ cells and subsequently analysed for the expression of IFN-γ (B) and IL-21 (D). Data indicate individual values and horizontal bars represent the median value. Right insets: representative histograms of IFN-γ- and IL-21-producing CD3+cells in LPMC isolated from 1 CD patient with no endoscopic recurrence (i0), 1 CD patient with endoscopic recurrence (i4), 1 CD patient with established/late lesions and 1 normal control. Staining with a control IgG is also shown. Numbers above lines indicate the percentages of positive cells.
Figure 3
Figure 3. IL-17A is over-expressed in CD.
Transcripts for IL-17A (A) were analysed in ileal samples taken from CD patients with no endoscopic recurrence (i0-i1), CD patients with endoscopic recurrence (i2-i4), CD patients with established/late lesions and normal controls by real-time PCR and normalized to β-actin. Data indicate individual values of IL-17A in single biopsies and horizontal bars represent the median value. B.Flow cytometry analysis of IL-17A-producing cells in CD3+LPMC isolated from CD patients with no endoscopic recurrence (i0-i1), CD patients with endoscopic recurrence (i2-i4), CD patients with established/late lesions and normal controls. LPMC were gated on CD3+ cells and subsequently analysed for the expression of IL-17A. Data indicate individual values and horizontal bars represent the median value. Right insets: representative histograms of IL-17A-producing CD3+cells in LPMC isolated from 1 CD patient with no endoscopic recurrence (i0), 1 CD patient with endoscopic recurrence (i4), 1 CD patient with established/late lesions and 1 normal control. Staining with a control IgG is also shown. Numbers above lines indicate the percentages of positive cells. C. Ratio between the percentages of IFN-γ-producing CD3+LPMC and IL-17A-producing CD3+ LPMC isolated from CD patients with no endoscopic recurrence (i0-i1), CD patients with endoscopic recurrence (i2-i4), CD patients with established/late lesions and normal controls.
Figure 4
Figure 4. IL-4, IL-5 and IL-13 are up regulated in CD tissue with early and established lesions.
Transcripts for IL-4 (A), IL-5 (E) and IL-13 (F) were analysed in ileal samples taken from CD patients with no endoscopic recurrence (i0–i1), CD patients with endoscopic recurrence (i2–i4), CD patients with established/late lesions and normal controls by real-time PCR and normalized to β-actin. Data indicate individual values of cytokines in single biopsies and horizontal bars represent the median value. B. Flow cytometry analysis of IL-4-producing cells in CD3+LPMC isolated from CD patients with no endoscopic recurrence (i0–i1), CD patients with endoscopic recurrence (i2–i4), CD patients with established/late lesions and normal controls. LPMC were gated on CD3+ cells and subsequently analysed for the expression of IL-4. Data indicate individual values and horizontal bars represent the median value. Right insets: representative histograms of IL-4-producing CD3+cells in LPMC isolated from 1 CD patient with no endoscopic recurrence (i0), 1 CD patient with endoscopic recurrence (i4), 1 CD patient with established/late lesions and 1 normal control. Staining with a control IgG is also shown. Numbers above lines indicate the percentages of positive cells. C–D. Ratio between the percentages of IFN-γ-producing (C) or IL-17A-producing (D) CD3+LPMC and IL-4-producing CD3+ LPMC isolated from CD patients with no endoscopic recurrence (i0–i1), CD patients with endoscopic recurrence (i2–i4), CD patients with established/late lesions and normal controls.
Figure 5
Figure 5. High IL-12 production in CD samples with or without macroscopically evident lesions.
Transcripts for IL-12p35 (A) and IL-12p40 (B) were evaluated in ileal samples taken from CD patients with no endoscopic recurrence (i0–i1), CD patients with endoscopic recurrence (i2–i4), CD patients with established/late lesions and normal controls by real-time PCR and normalized to β-actin. Data indicate individual values of IL-12/p35 and IL-12/p40 in single biopsies and horizontal bars represent the median value. C. IL-12 heterodimer was measured in total proteins were extracted from ileal biopsies of CD patients with no endoscopic recurrence (i0–i1), CD patients with endoscopic recurrence (i2–i4), CD patients with established/late lesions and normal controls by ELISA. Data indicate individual values of IL-12 in single biopsies and horizontal bars are the median value.
Figure 6
Figure 6. Distinct induction of IL-23, IL-6 and TNF-α in Crohn’s disease mucosa with or without lesions.
Transcripts for IL-23p19 (A), TNF-α (B) and IL-6 (C) were evaluated in ileal samples taken from CD patients with no endoscopic recurrence (i0–i1), CD patients with endoscopic recurrence (i2–i4), CD patients with established/late lesions and normal controls by real-time PCR and normalized to β-actin. Data indicate individual values of the cytokines in single biopsies and horizontal bars represent the median value.

Similar articles

Cited by

References

    1. Kaser A, Zeissig S, Blumberg RS (2010) Inflammatory bowel disease. Annu Rev Immunol 28: 573–621. - PMC - PubMed
    1. Strober W, Fuss I, Mannon P (2007) The fundamental basis of inflammatory bowel disease. J Clin Invest 117: 514–521. - PMC - PubMed
    1. Fuss IJ, Neurath M, Boirivant M, Klein JS, de la Motte C, et al. (1996) Disparate CD4+ lamina propria (LP) lymphokine secretion profiles in inflammatory bowel disease. Crohn’s disease LP cells manifest increased secretion of IFN-gamma, whereas ulcerative colitis LP cells manifest increased secretion of IL-5. J Immunol 157: 1261–1270. - PubMed
    1. Neurath MF, Weigmann B, Finotto S, Glickman J, Nieuwenhuis E, et al. (2002) The transcription factor T-bet regulates mucosal T cell activation in experimental colitis and Crohn’s disease. J Exp Med 195: 1129–1143. - PMC - PubMed
    1. Monteleone G, Biancone L, Marasco R, Morrone G, Marasco O, et al. (1997) Interleukin 12 is expressed and actively released by Crohn’s disease intestinal lamina propria mononuclear cells. Gastroenterology 112: 1169–1178. - PubMed

Publication types

MeSH terms