. 2013;8(1):e54579.
doi: 10.1371/journal.pone.0054579. Epub 2013 Jan 21.

Tumor cells positive and negative for the common cancer stem cell markers are capable of initiating tumor growth and generating both progenies

Affiliations

Tumor cells positive and negative for the common cancer stem cell markers are capable of initiating tumor growth and generating both progenies

Sheng-Dong Huang et al. PLoS One. 2013.

Abstract

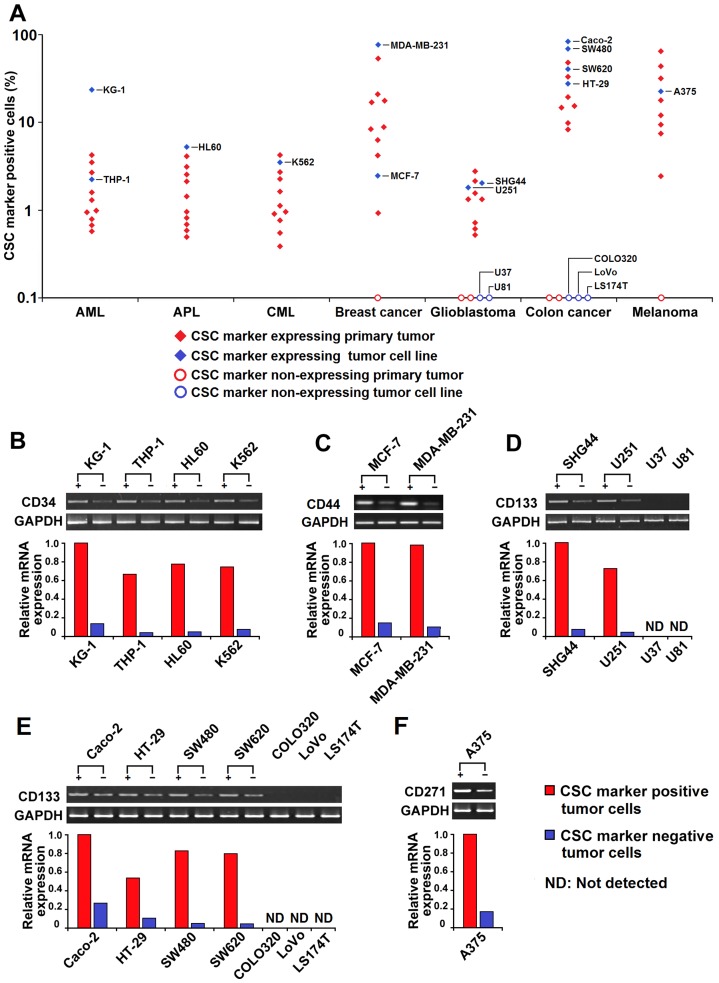
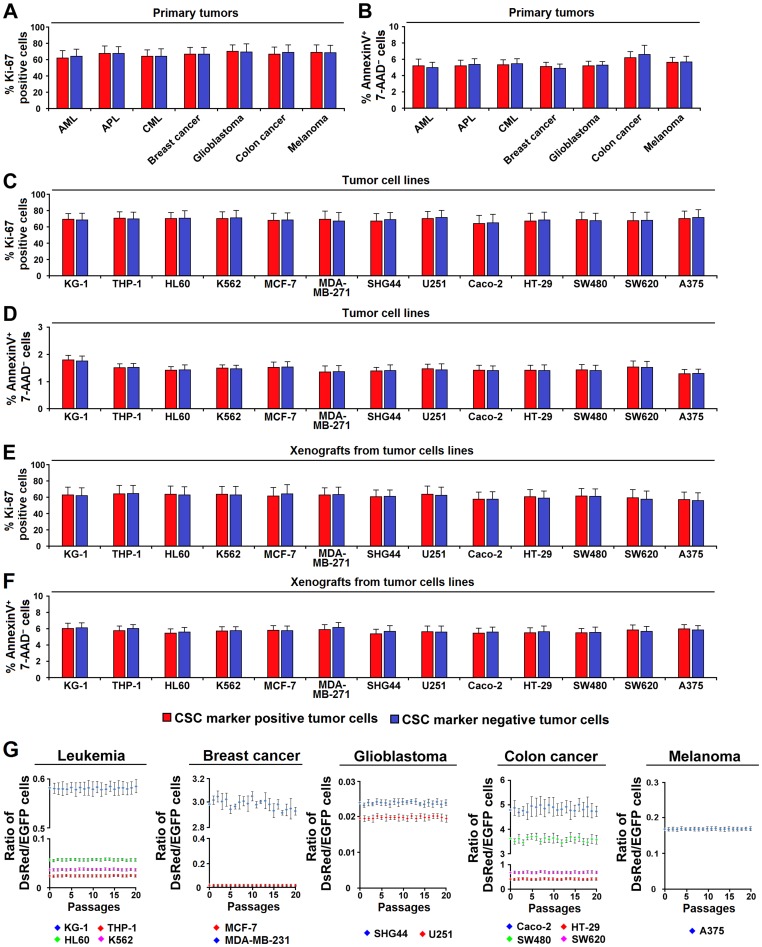
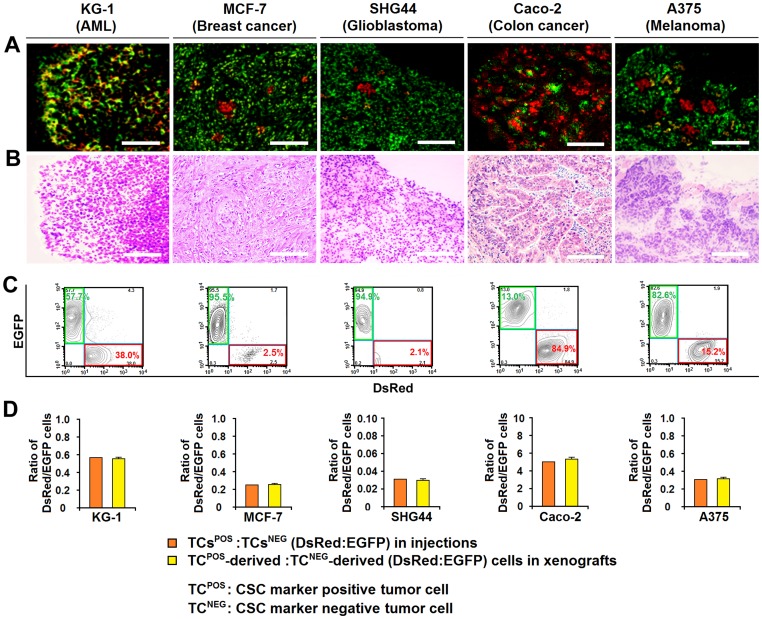
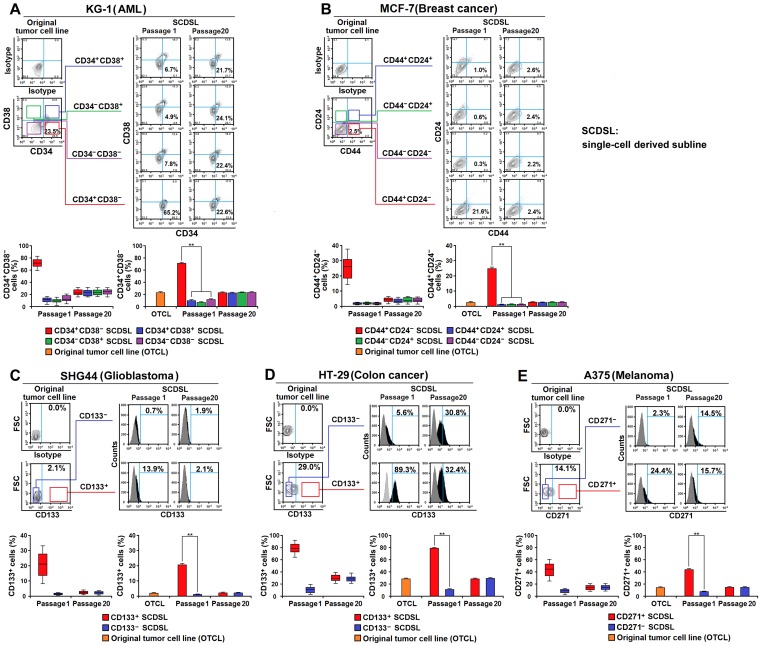
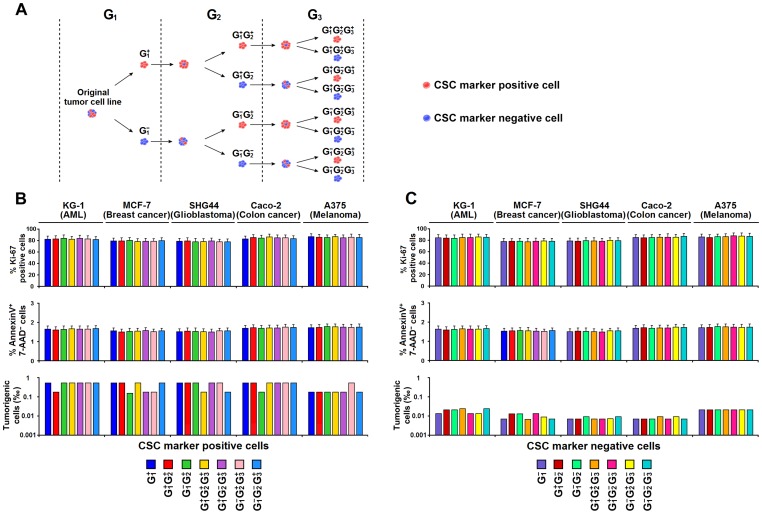
The cancer stem cell (CSC) model depicts that tumors are hierarchically organized and maintained by CSCs lying at the apex. CSCs have been "identified" in a variety of tumors through the tumor-forming assay, in which tumor cells distinguished by a certain cell surface marker (known as a CSC marker) were separately transplanted into immunodeficient mice. In such assays, tumor cells positive but not negative for the CSC marker (hereby defined as CSC(+) and CSC(-) cells, respectively) have the ability of tumor-forming and generating both progenies. However, here we show that CSC(+) and CSC(-) cells exhibit similar proliferation in the native states. Using a cell tracing method, we demonstrate that CSC(-) cells exhibit similar tumorigenesis and proliferation as CSC(+) cells when they were co-transplanted into immunodeficient mice. Through serial single-cell derived subline construction, we further demonstrated that CSC(+) and CSC(-) cells from CSC marker expressing tumors could invariably generate both progenies, and their characteristics are maintained among different generations irrespective of the origins (CSC(+)-derived or CSC(-)-derived). These findings demonstrate that tumorigenic cells cannot be distinguished by common CSC markers alone and we propose that cautions should be taken when using these markers independently to identify cancer stem cells due to the phenotypic plasticity of tumor cells.


Conflict of interest statement

Competing Interests: The authors have declared that no competing interests exist.

Figures

Figure 1
Figure 1. Expression of CSC marker in human primary tumors and tumor cell lines.
(A) The percentage of CSC marker positive cells from human primary tumors (n = 10 for each type) and tumor cell lines. Single cell suspensions were prepared, followed by flow cytometric analysis. Dots represent the percentage of CD34+CD38 cells in AML, APL, and CML, CD44+CD24 cells in breast cancer, CD133+ cells in glioblastoma and colon cancer, and CD271+ cells in melanoma samples. (B–F) The CSC marker mRNA expression level of cells (CSC+ and CSC cells from CSC marker expressing tumor cell lines, and cells from non-expression tumor cell lines) was analyzed by qRT-PCR and normalized to GAPDH. The level of CD34 mRNA in KG-1 CSC+ cells, CD44 mRNA in MCF-7 CSC+ cells, CD133 mRNA in SHG-44 and Caco-2 CSC+ cells, CD271 mRNA in A375 CSC+ cells, was arbitrarily designated as 1.0 for leukemia, breast cancer, glioblastoma, colon cancer, melanoma samples, respectively. Photographs show the RT-PCR products and histograms show the CSC marker mRNA expression level of cells from leukemia (B), breast cancer (C), glioblastoma (D), colon cancer (E), and melanoma (F) cell lines. Note that cells from CSC marker non-expressing tumor cell lines (U37, U81, COLO320, LoVo, LS174T) do not express CSC marker mRNA.
Figure 2
Figure 2. CSC+ and CSC tumor cells display similar proliferative capacity in the native state.
(A, B) CSC marker expressing primary sample were selected to undergo Ki-67 expression and apoptosis analysis. Data represent mean ± SEM; n = 10 for each type of leukemia, n = 8 for glioblastoma and for colon cancer, n = 9 for breast cancer and for melanoma. (A) Ki-67 expression of CSC+ and CSC cells from human primary tumors. Single cell suspensions of human primary tumors were stained with antibodies specific to the CSC markers and Ki-67-FITC, followed by flow cytometric analysis. (B) Apoptosis assay of CSC+ and CSC cells from human primary tumors. Single cell suspensions of human primary tumors were stained with antibodies specific to the CSC markers and Annexin V-FITC/7-ADD, followed by flow cytometric analysis. (C–D) Ki-67 expression (C) and apoptosis (D) assay of CSC+ and CSC cells from human tumor cell lines cultured in serum-containing medium. Data represent mean ± SEM from 3 independent experiments. (E–F) Ki-67 expression (E) and apoptosis (F) assay of CSC+ and CSC cells of xenografts derived from human tumor cell lines. Data represent mean ± SEM from 3 independent experiments. (G) DsRed-labeled CSC+ and EGFP-labeled CSC cells originating from the same tumor cell lines were mixed according to their original ratios and co-cultured in serum-containing medium for 20 passages. Dots show the ratio of CSC+-derived to CSC-derived (DsRed:EGFP) cells at different passages. Data represent mean ± SEM from 3 independent experiments.
Figure 3
Figure 3. CSC+ and CSC tumor cells display similar tumor-forming capacity upon co-transplantation.
(A and B) DsRed-labeled CSC+ and EGFP-labeled CSC cells originating from the same tumor cell lines were mixed to their original ratio and co-transplanted into sublethally irradiated NOD-SCID mice. Photographs represent fluorescent images (A) and hematoxylin and eosin staining (B) of serial sections of the xenografts derived from KG-1, MCF-7, SHG44, Caco-2 and A375. Scale bar  = 100 μm. (C) Flow cytometric contour plots show the percentage of DsRed and EGFP cells in the xenografts. (D) Histograms show the ratio of CSC+ to CSC (DsRed:EGFP) cells in injections and the ratio of CSC+-derived to CSC-derived (DsRed:EGFP) cells in xenografts. Data represent mean ± SEM from 3 independent experiments.
Figure 4
Figure 4. CSC and CSC+ tumor cells can generate both progenies.
(A–E) CSC+ and CSC cells from the original tumor cell lines were selected to generate single-cell derived sublines (SCDSLs). The percentage of CSC marker positive cells in the original tumor cell lines or SCDSLs (passage 1 and passage 20) of KG-1 (A), MCF-7 (B), SHG44 (C), HT-29 (D), and A375 (E) was analyzed by flow cytometry. Box plots show the percentage of CSC marker positive cells in SCDSLs, with the whiskers representing the minimum and maximum values, the central lines representing the median value, and the boxes representing the 25th and 75th percentile. Histograms show the percentage of CSC marker positive cells in original tumor cell lines and SCDSLs. Data of SCDSLs represent mean ± SEM from 100 samples; Data of original tumor cell lines represent mean ± SEM from 3 independent experiments; ** P<0.01 by independent t-test.
Figure 5
Figure 5. There is no CSC marker based hierarchy in CSC marker expressing tumors.
(A) Schematic diagram shows the construction of serial single-cell derived sublines (SCDSLs). CSC+ and CSC cells from the original tumor cell lines were selected to generate SCDSLs and arbitrarily classified as generation 1 SCDSLs (including G1 + and G1 ). CSC+ and CSC cells from G1 SCDSLs were selected to generate G2 SCDSLs (including G1 +G2 +, G1 G2 +, G1 +G2 and G1 G2 ). We repeated the procedure until G3 SCDSLs were obtained. (B–E) The percentage of CSC marker positive cells in SCDSLs from KG-1, MCF-7, SHG44, Caco-2 and A375 was analyzed by flow cytometry when the cell quantity reached approximately 1×10⁶. Box plots show the percentage of CSC marker positive cells in single CSC+-derived (B) and CSC-derived (C) sublines from different generations, with the whiskers representing the minimum and maximum values, the central lines representing the median value, and the boxes representing the 25th and 75th percentile. Histograms show the percentage of CSC marker positive cells in single CSC+-derived (D) and CSC-derived (E) sublines from different generations. Data represent mean ± SEM from 100 samples, each from one independent serial SCDSL construction.
Figure 6
Figure 6. Proliferation and tumorigenesis of the CSC+ (or CSC) cells from different generations are comparable.
(A) Schematic diagram shows the cell classification based on generation and CSC marker expression. Cells from the original tumor cell lines were arbitrarily classified as generation 1 (G1) cells and sorted into CSC marker positive (G1 +) and negative (G1 ) cells. G1 + and G1 cells were then propagated (from 1×10² to approximately 1×10⁸) to generate G2 (including G1 +G2 +, G1 +G2 , G1 G2 + and G1 G2 ) cells. We repeated the procedure until G3 cells were obtained. (B and C) CSC+ and CSC cells from different generations were used for proliferative and tumorigenic assays. Histograms show the percentage of Ki-67 positive cells, the percentage of Annexin V+ 7-AAD cells, and the frequency of tumorigenic cells of CSC+ cells (B) and CSC cells (C) from different generations in KG-1, MCF7, SHG44, Caco-2 and A375. Frequency of tumorigenic cells was calculated using Extreme Limiting Dilution Analysis software. Other data are expressed as mean ± SEM from 3 independent experiments.

Similar articles

Cited by

References

    1. Visvader JE, Lindeman GJ (2008) Cancer stem cells in solid tumours: accumulating evidence and unresolved questions. Nat Rev Cancer 8: 755–768. - PubMed
    1. Dick JE (2009) Looking ahead in cancer stem cell research. Nat Biotechnol 27: 44–46. - PubMed
    1. Patrawala L, Calhoun T, Schneider-Broussard R, Li H, Bhatia B, et al. (2006) Highly purified CD44+ prostate cancer cells from xenograft human tumors are enriched in tumorigenic and metastatic progenitor cells. Oncogene 25: 1696–1708. - PubMed
    1. Hermann PC, Huber SL, Herrler T, Aicher A, Ellwart JW, et al. (2007) Distinct populations of cancer stem cells determine tumor growth and metastatic activity in human pancreatic cancer. Cell Stem Cell 1: 313–323. - PubMed
    1. Bao S, Wu Q, McLendon RE, Hao Y, Shi Q, et al. (2006) Glioma stem cells promote radioresistance by preferential activation of the DNA damage response. Nature 444: 756–760. - PubMed

Publication types