

PARK2 mediates interleukin 6 and monocyte chemoattractant protein 1 production by human macrophages
- PMID: 23350010
- PMCID: PMC3547867
- DOI: 10.1371/journal.pntd.0002015
PARK2 mediates interleukin 6 and monocyte chemoattractant protein 1 production by human macrophages
Abstract
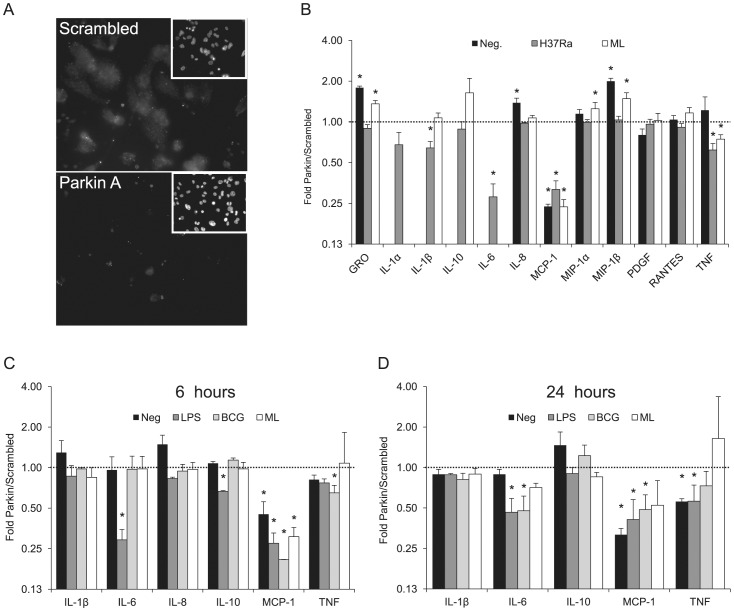
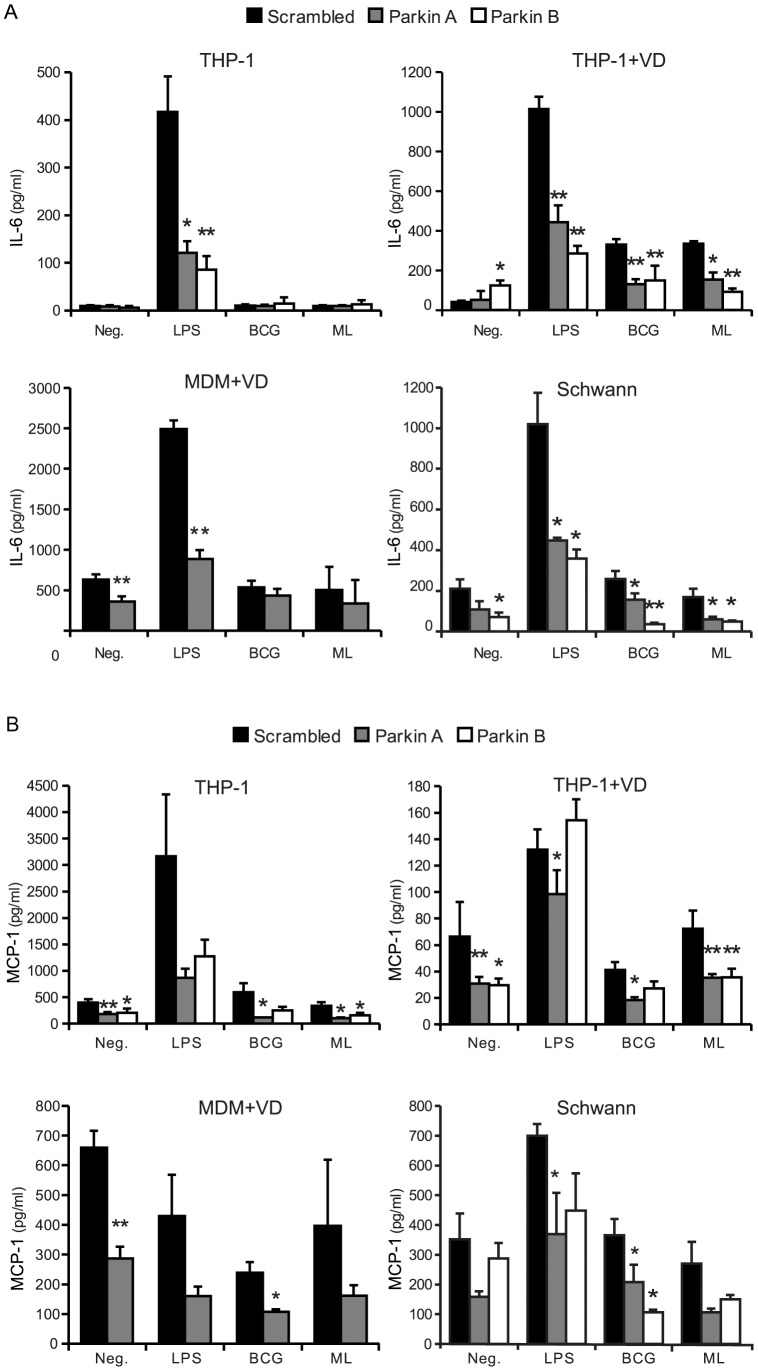
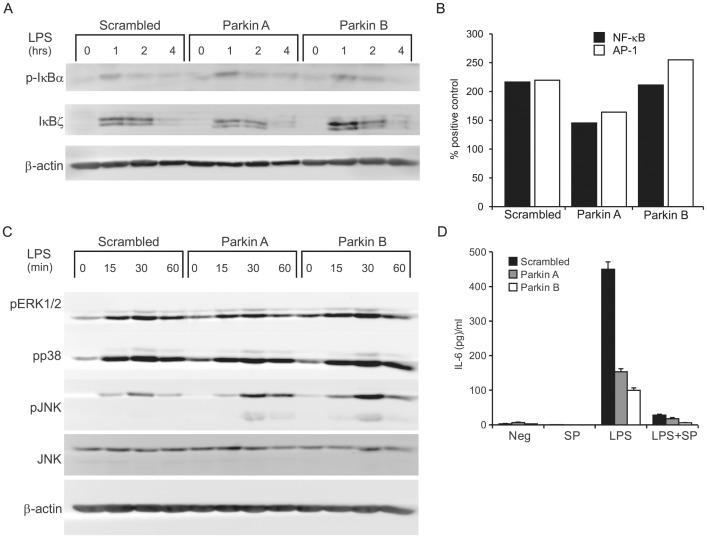
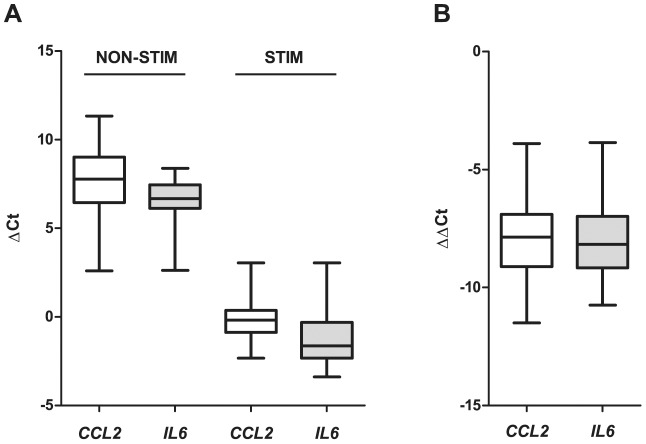
Leprosy is a persistent infectious disease caused by Mycobacterium leprae that still affects over 200,000 new patients annually. The host genetic background is an important risk factor for leprosy susceptibility and the PARK2 gene is a replicated leprosy susceptibility candidate gene. The protein product of PARK2, Parkin, is an E3 ubiquitin ligase that is involved in the development of various forms of Parkinsonism. The human macrophage is both a natural host cell of M. leprae as well as a primary mediator of natural immune defenses, in part by secreting important pro-inflammatory cytokines and chemokines. Here, we report that down-regulation of Parkin in THP-1 macrophages, human monocyte-derived macrophages and human Schwann cells resulted in a consistent and specific decrease in interleukin-6 (IL-6) and monocyte chemoattractant protein 1 (MCP-1/CCL2) production in response to mycobacteria or LPS. Interestingly, production of IL-6 at 6 hours by THP-1 cells stimulated with live M. leprae and M. bovis BCG was dependent on pretreatment with 1,25-dihydroxyvitamin D(3) (VD). Parkin knockdown in VD-treated cells blocked IL-6 induction by mycobacteria. However, IκB-α phosphorylation and levels of IκB-ξ, a nuclear protein required for IL-6 expression, were not affected by Parkin silencing. Phosphorylation of MAPK ERK1/2 and p38 was unaffected by Parkin silencing while JNK activation was promoted but did not explain the altered cytokine production. In a final set of experiments we found that genetic risk factors of leprosy located in the PARK2 promoter region were significantly correlated with M. leprae sonicate triggered CCL2 and IL6 transcript levels in whole blood assays. These results associated genetically controlled changes in the production of MCP-1/CCL2 and IL-6 with known leprosy susceptibility factors.
Conflict of interest statement
The authors have declared that no competing interests exist.
Figures
Similar articles
-
Gene expression profiling specifies chemokine, mitochondrial and lipid metabolism signatures in leprosy.PLoS One. 2013 Jun 14;8(6):e64748. doi: 10.1371/journal.pone.0064748. Print 2013. PLoS One. 2013. PMID: 23798993 Free PMC article.
-
Differential production of interleukin 1 (IL-1), IL-6, tumor necrosis factor, and IL-1 receptor antagonist by human monocytes stimulated with Mycobacterium leprae and M. bovis BCG.Int J Lepr Other Mycobact Dis. 1993 Dec;61(4):609-18. Int J Lepr Other Mycobact Dis. 1993. PMID: 8151194
-
Large-Scale Gene Expression Signatures Reveal a Microbicidal Pattern of Activation in Mycobacterium leprae-Infected Monocyte-Derived Macrophages With Low Multiplicity of Infection.Front Immunol. 2021 Apr 16;12:647832. doi: 10.3389/fimmu.2021.647832. eCollection 2021. Front Immunol. 2021. PMID: 33936067 Free PMC article.
-
Genetic predisposition to leprosy: A major gene reveals novel pathways of immunity to Mycobacterium leprae.Semin Immunol. 2006 Dec;18(6):404-10. doi: 10.1016/j.smim.2006.07.005. Epub 2006 Sep 14. Semin Immunol. 2006. PMID: 16973374 Review.
-
Genetic dissection of immunity in leprosy.Curr Opin Immunol. 2005 Feb;17(1):44-8. doi: 10.1016/j.coi.2004.11.006. Curr Opin Immunol. 2005. PMID: 15653309 Review.
Cited by
-
Reduced inflammation and cytokine production in NKLAM deficient mice during Streptococcus pneumoniae infection.PLoS One. 2018 Mar 8;13(3):e0194202. doi: 10.1371/journal.pone.0194202. eCollection 2018. PLoS One. 2018. PMID: 29518136 Free PMC article.
-
Parkin deficiency modulates NLRP3 inflammasome activation by attenuating an A20-dependent negative feedback loop.Glia. 2018 Aug;66(8):1736-1751. doi: 10.1002/glia.23337. Epub 2018 Apr 17. Glia. 2018. PMID: 29665074 Free PMC article.
-
Immune diseases caused by mutations in kinases and components of the ubiquitin system.Nat Immunol. 2014 Jun;15(6):521-9. doi: 10.1038/ni.2892. Nat Immunol. 2014. PMID: 24840983 Free PMC article. Review.
-
Loss of Microglial Parkin Inhibits Necroptosis and Contributes to Neuroinflammation.Mol Neurobiol. 2019 Apr;56(4):2990-3004. doi: 10.1007/s12035-018-1264-9. Epub 2018 Aug 3. Mol Neurobiol. 2019. PMID: 30074231
-
DNA methylation in blood-Potential to provide new insights into cell biology.PLoS One. 2020 Nov 4;15(11):e0241367. doi: 10.1371/journal.pone.0241367. eCollection 2020. PLoS One. 2020. PMID: 33147241 Free PMC article.
References
-
- WHO (2010) Global leprosy situation (2010). Weekly Epidemiological Record (WER) 85. - PubMed
-
- Chakravarti MR, Vogel F (1973) A twin study on leprosy. Georg Thieme, Stuttgart. pp.1–123.
-
- Abel L, Lap VD, Oberti L, Thuc NV, Cua VV, et al. (1995) Complex segregation analysis of leprosy in Southern Vietnam. Genet Epidemiol 12: 63–82. - PubMed
-
- Schurr E, Gros P (2009) A common genetic fingerprint in leprosy and Crohn's disease? N Engl J Med 361: 2666–2668. - PubMed
Publication types
MeSH terms
Substances
Grants and funding
LinkOut - more resources
Full Text Sources
Other Literature Sources
Research Materials
Miscellaneous
