Comparative Study
. 1990 May;66(5):1328-44.
doi: 10.1161/01.res.66.5.1328.

Molecular and particulate depositions for regional myocardial flows in sheep

Affiliations
Comparative Study

Molecular and particulate depositions for regional myocardial flows in sheep

J B Bassingthwaighte et al. Circ Res. 1990 May.

Abstract

The deposition of microspheres in small tissue regions is not strictly flow dependent. In comparison with the soluble flow marker 2-iododesmethylimipramine (IDMI), deposition of 16.5-microns microspheres was mildly but systematically biased into high flow regions of rabbit hearts (Bassingthwaighte JB, Malone MA, Moffett T-C, King RB, Little SE, Link JM, Krohn KA. Am J Physiol 1987;253 (Heart Circ Physiol 22):H184-H193). To examine the possibility of bias in larger hearts, a similar study was undertaken in sheep. 141Ce- and 103Ru-labeled 16.5-microns microspheres in one syringe and 125I- and 131I-DMI in another syringe were injected simultaneously into the left atrium of five open-chest sheep while obtaining reference blood samples from the femoral artery. In six other sheep, one microsphere type and one IDMI were used. Hearts were removed 1 minute after injection, cut into approximately 254 pieces averaging 217 mg, and regional deposition densities calculated for each tracer from the isotopic counts. Correlations in the five animals between the two differently labeled IDMIs and between the two microspheres were both greater than or equal to 0.98. In all 11 sheep, scatter plots of microsphere deposition densities versus IDMI densities showed that differences between microspheres and IDMI had substantially more scatter (0.84 less than r less than 0.98) but were not random. Microsphere depositions tended to be lower than IDMI depositions in low flow regions and higher in high flow regions, in accord with the expected bias that at a bifurcation a microsphere is most likely to enter the branch with higher flow. There was less bias ascribable to endomyocardial/epicardial maldistribution. Thus, while microsphere depositions appear to err systematically with respect to flow when the regions of interest are small enough that the diameters of their arterioles are only a few times those of the microspheres, microspheres are, in sheep as in rabbits, adequate for estimating regional flows.


Figures

Figure 1
Figure 1
2-Iododesmethylimipramine (IDMI) extraction in sheep heart. Outflow dilution curves from coronary sinus after injection of 10 μCi 125I-albumin and 40 μCi of 131I-DMI into the left atrium were normalized to give the fraction injected dose emerging in the effluent per second, h(t). Extraction was >95% over the course of the albumin dilution curve.
Figure 2
Figure 2
Intraexperiment paired controls defining methodological error in one sheep heart. Left panel: Linear scatter plot of 125I-DMI versus 131I-DMI deposition densities in the ventricular myocardium of one sheep; r=0.995; percent differences averaged 3.7% (N=255). Right panel: Linear scatter plot of 141Ce-microsphere versus 103Ru-microsphere deposition densities in the same animal. For the 255 pieces, r=0.992; percent differences averaged 5.4%.
Figure 3
Figure 3
Assessment of error in the deposition technique as a function of amount of tracer or number of spheres deposited per sample of myocardium. The ordinates are absolute values of percent differences between paired observations in five sheep (1,258 pieces in total). Left upper panel: Paired differences for microsphere depositions versus number of spheres per tissue sample of about 0.2 g size. Confidence limits are shown at 68% (1 SD, continuous line) and 95% (2 SD, dashed) of the observations in 11 classes encompassing the range. Left lower panel: Percent differences between two 2-iododesmethylimipramines (IDMIs) versus isotopic activity per tissue sample. The 68% and 95% confidence limits are shown. Right panel: Comparison of IDMI and microsphere confidence limits plotted against regional flow (fj) as measured by IDMI deposition in the sample.
Figure 4
Figure 4
Microsphere deposition densities (dj) versus IDMI deposition densities (fj) which are used as the measure of relative regional flow. Each dj is the average of two observations in each piece, as is each fj. Left panel: Sheep 220586: Mean ventricular flow, F’H=1.27 ml g−1 min−1; the regression line (reported in Table 2) has a slope greater than 1, and a correlation coefficient of r=0.946. Right panel: Sheep 290586: F’H=0.71 ml g−1 min−1; r=0.966. This sheep was one with a low slope of the linear regression.
Figure 5
Figure 5
Left panel: Microsphere deposition densities versus 2-iododesmethylimipramine (IDMI) deposition densities in ventricular myocardium of 11 open-chest sheep. The best fitting linear regression line was dj=1.268fi–0.255; r=0.925, N=2,789; the best fitting quadratic through the origin was dj=0.765fj+0.220fj2; (r=0.945), and the best power function was dj=0.992fj1.24 (r=0.948). The line of identity is given as a reference. Right panel: Microsphere versus 3H-DMI deposition densities in left ventricular myocardium of one open-chest sheep. The best fitting linear regression is dj=1.463fj–0.5252; r=0.909, N=505 pieces of average size 120±7.5 mg. The best fitting quadratic through the origin was dj=0.575fj+0.354fj2 (coefficient of variation [C. V]=0.13), and the best power function was dj=0.929fj1.45 (C.V=0.13).
Figure 6
Figure 6
Estimated distributions of regional flows in sheep hearts. Left panel: Distributions of relative deposition densities for two different 2-iododesmethylimipramine (IDMIs) and two different microspheres in the ventricular myocardium of an open-chest sheep. The mean for each distribution is, by definition, one. For clarity of presentation, the histograms are represented by polygons joining the midpoints of the classes. The standard deviations of the distributions for the IDMIs were 0.169 and 0.173, and for the microspheres were 0.277 and 0.276. Right panel: Distributions of tritiated DMI (3H-DMI) and microspheres in left ventricular myocardium of one sheep. Relative dispersions were 35.8% for microspheres and 24.4% for 3H-DMI. Skewnesses were 1.52 and 1.27
Figure 7
Figure 7
Composite distributions of relative deposition densities in the ventricular myocardium of 11 open-chest sheep. The data are classed within intervals of 0.1 (10% of the mean). wi, the fractions of organ per unit mean flow having flows in the specified class. The bars are the standard deviations for each class (N=11 hearts). (For five hearts, values were calculated from the mean of the two 2-iododesmethylimipramine [IDMI] or two microsphere deposition densities in each piece.) Left panel: IDMI distribution; relative deposition is 34%. Right panel: Microsphere distribution. Relative deposition is 40%. The dashed line gives the mean IDMI distribution from the left panel for comparison.
Figure 8
Figure 8
Myocardial flow distributions in sheep hearts sectioned into 0.21-g pieces. Left panel: Composite distributions of myocardial blood flows in left and right ventricles in hearts of 11 anesthetized sheep obtained from 2-iododesmethylimipramine (IDMI) distributions. Right panel: Microsphere distributions. (Points with di>2.3 not plotted but included in relative depositions.)
Figure 9
Figure 9
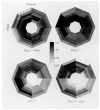
Spatial distibutions of flows (by 2-iododesmethylimipramine deposition) in the ventricular myocardium of a sheep (#050686). Intensities represent local flows relative to the mean for the heart (fj). The four octagonal rings represent about 1-cm thick left ventricular rings. In each 45° sector there were six slices from endocardium to epicardium. For each ring, septum is left, free wall is right, and posterior wall is above.
Figure 10
Figure 10
Average spatial profiles of regional flows (by 2-iododesmethylimipramine depositions) in the left ventricular myocardium of 11 sheep. The dark region of higher than average flow in the second ring is in the region of delivery of the septal artery. Note that endocardial flows are not very different from epicardial Relative flows (fj) in this composite picture range from 0.8 to 1.4 times the whole heart mean flow. A Student’s t test was used to define regions whose average for the 11 sheep differed from the mean of 1.0 for the 11 sheep for the whole left ventricle.
Figure 11
Figure 11
Average spatial profiles of the ratios of microsphere to 2-iododesmethylimipramine depositions in individual locations of left ventricular myocardium of 11 sheep. Each location is an average for that piece in 11 hearts. Differences from the mean of 1.0 are indicated by the symbols (Student’s t test). dj, relative deposition density; fj, relative flow.
Figure 12
Figure 12
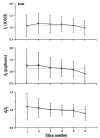
Biased deposition of microspheres in subendocardial regions and deprivation in subepicardial regions of the sheep left ventricular myocardium. Data are from 11 animals. The dotted line represents the left ventricular mean relative to the whole heart mean of 1.0. Each point represents about 350 pieces of tissue (eight sectors×four rings×11 animals). Bars give ±1 SD; small boxes give ±1 SEM. Upper panel: Average transmural profiles in flow (fj) by 2-iododesmethylimipramine (IDMI) depositions. Middle panel: Average transmural profile of microsphere depositions (dj). Lower panel: Means of ratios of normalized microsphere to IDMI depositions in individual slices from endocardium to epicardium. The slope of the linear regression differs from unity, and both end points also differ from unity.

References

    1. Bassingthwaighte JB, Malone MA, Moffett TC, King RB, Little SE, Link JM, Krohn KA. Validity of microsphere depositions for regional myocardial flows. Am J Physiol. 1987;253(22):H184–H193. Heart Circ Physiol. - PMC - PubMed
    1. Yipintsoi T, Dobbs WA, Jr, Scanlon PD, Knopp TJ, Bassingthwaighte JB. Regional distribution of diffusible tracers and carbonized microspheres in the left ventricle of isolated dog hearts. Circ Res. 1973;33:573–587. - PMC - PubMed
    1. King RB, Bassingthwaighte JB, Hales JRS, Rowell LB. Stability of heterogeneity of myocardial blood flow in normal awake baboons. Circ Res. 1985;57:285–295. - PMC - PubMed
    1. King RB, Bassingthwaighte JB. Radioactivity. In: Reneman RS, Strackee J, editors. Data in Medicine. Martinus Nijhoff; The Hague, Netherlands: 1979. pp. 79–113.
    1. Baer RW, Payne BD, Verrier ED, Vlahakes GJ, Molodowitch D, Uhlig PN, Hoffman JIE. Increased number of myocardial blood flow measurements with radionuclide-labeled microspheres. Am J Physiol. 1984;246(15):H418–H434. Heart Circ Physiol. - PubMed

Publication types