

Paramecium BBS genes are key to presence of channels in Cilia
- PMID: 23351336
- PMCID: PMC3556005
- DOI: 10.1186/2046-2530-1-16
Paramecium BBS genes are key to presence of channels in Cilia
Abstract
Background: Changes in genes coding for ciliary proteins contribute to complex human syndromes called ciliopathies, such as Bardet-Biedl Syndrome (BBS). We used the model organism Paramecium to focus on ciliary ion channels that affect the beat form and sensory function of motile cilia and evaluate the effects of perturbing BBS proteins on these channels.
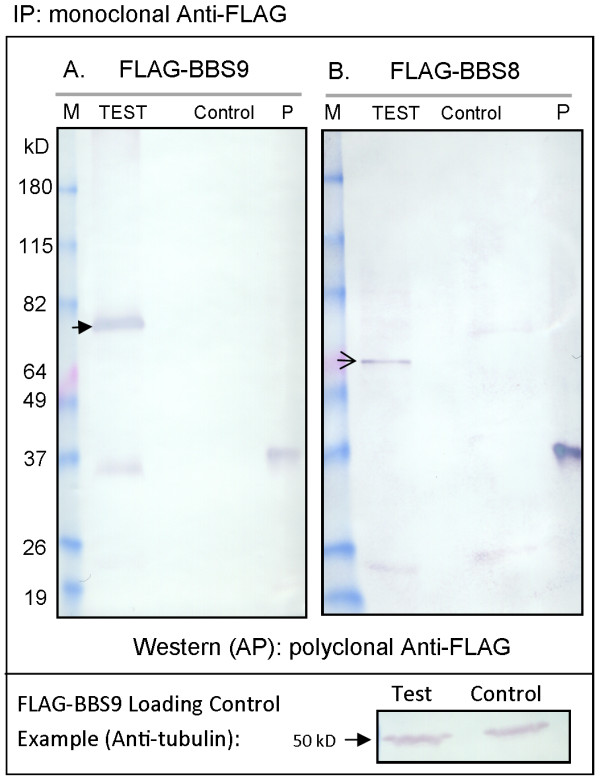
Methods: We used immunoprecipitations and mass spectrometry to explore whether Paramecium proteins interact as in mammalian cells. We used RNA interference (RNAi) and swimming behavior assays to examine the effects of BBS depletion on ciliary ion channels that control ciliary beating. Combining RNA interference and epitope tagging, we examined the effects of BBS depletion of BBS 7, 8 and 9 on the location of three channels and a chemoreceptor in cilia.
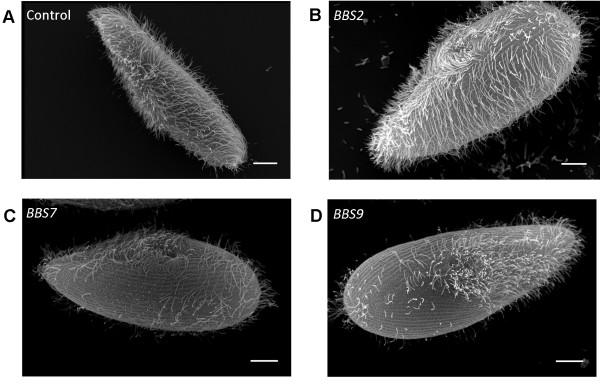
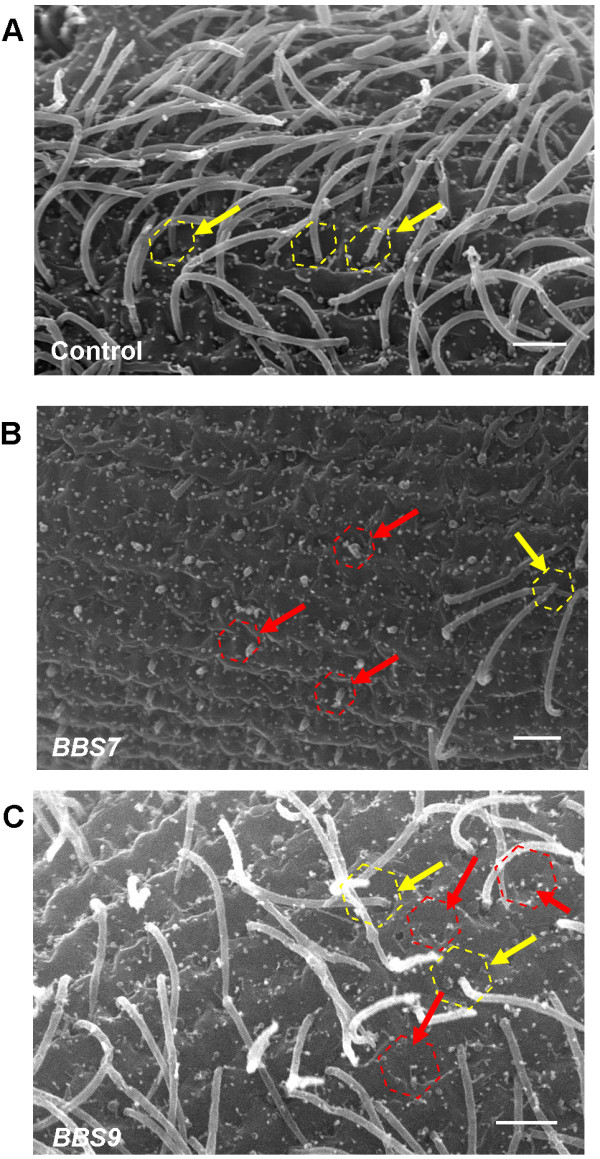
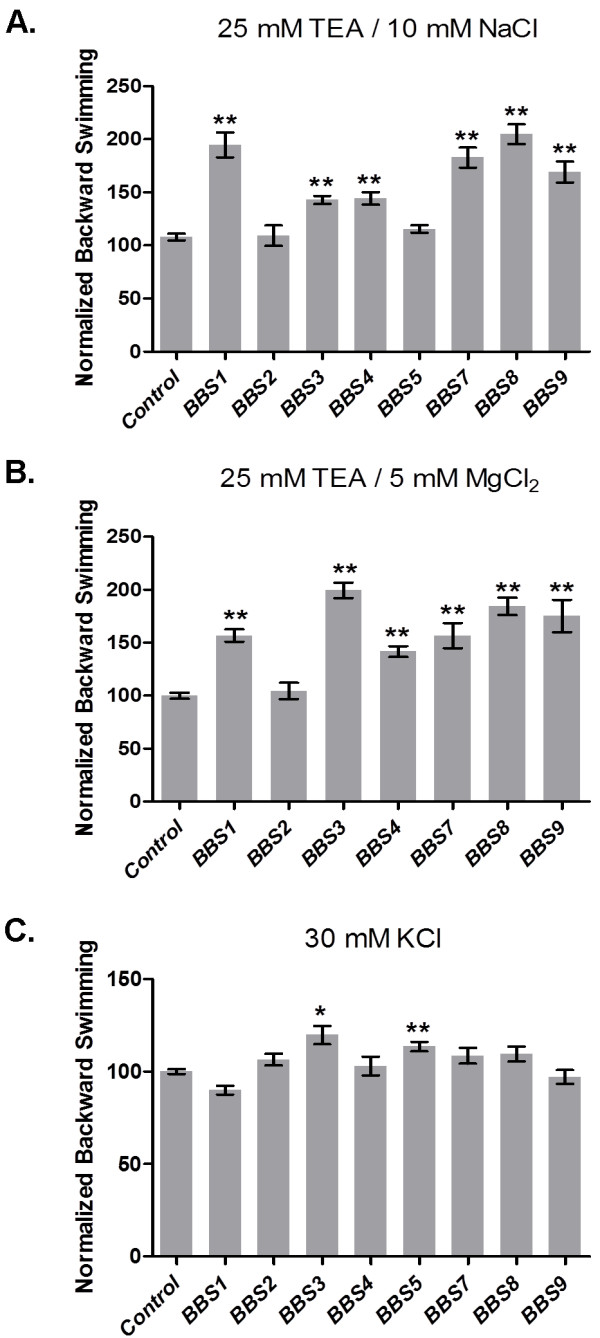
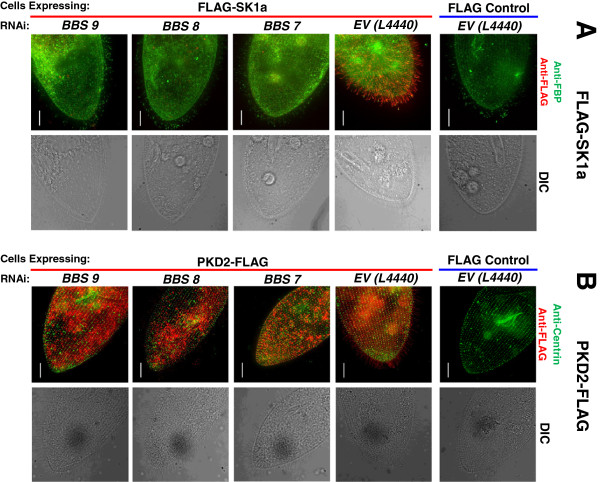
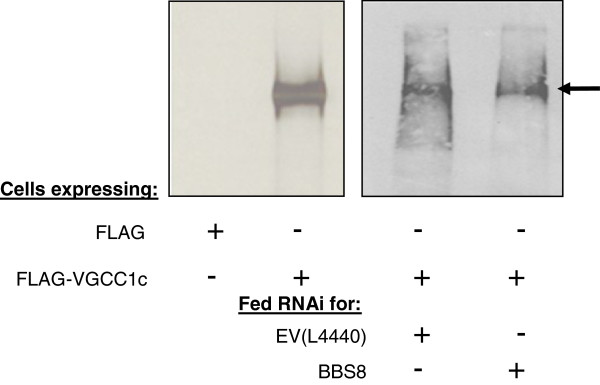
Results: We found 10 orthologs of 8 BBS genes in P. tetraurelia. BBS1, 2, 4, 5, 7, 8 and 9 co-immunoprecipitate. While RNAi reduction of BBS 7 and 9 gene products caused loss and shortening of cilia, RNAi for all BBS genes except BBS2 affected patterns of ciliary motility that are governed by ciliary ion channels. Swimming behavior assays pointed to loss of ciliary K+ channel function. Combining RNAi and epitope tagged ciliary proteins we demonstrated that a calcium activated K+ channel was no longer located in the cilia upon depletion of BBS 7, 8 or 9, consistent with the cells' swimming behavior. The TRPP channel PKD2 was also lost from the cilia. In contrast, the ciliary voltage gated calcium channel was unaffected by BBS depletion, consistent with behavioral assays. The ciliary location of a chemoreceptor for folate was similarly unperturbed by the depletion of BBS 7, 8 or 9.
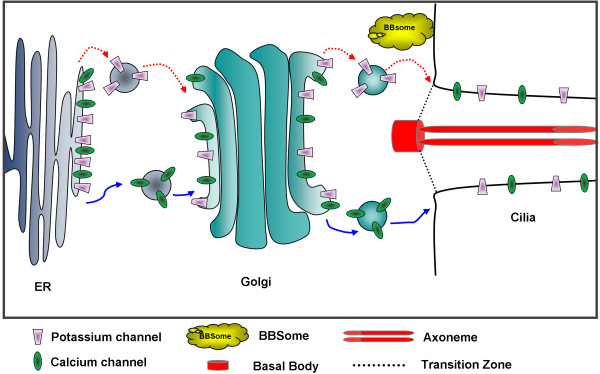
Conclusions: The co-immunoprecipitation of BBS 1,2,4,5,7,8, and 9 suggests a complex of BBS proteins. RNAi for BBS 7, 8 or 9 gene products causes the selective loss of K+ and PKD2 channels from the cilia while the critical voltage gated calcium channel and a peripheral receptor protein remain undisturbed. These channels govern ciliary beating and sensory function. Importantly, in P. tetraurelia we can combine studies of ciliopathy protein function with behavior and location and control of ciliary channels.
Figures

Similar articles
-
Paramecium, a Model to Study Ciliary Beating and Ciliogenesis: Insights From Cutting-Edge Approaches.Front Cell Dev Biol. 2022 Mar 14;10:847908. doi: 10.3389/fcell.2022.847908. eCollection 2022. Front Cell Dev Biol. 2022. PMID: 35359441 Free PMC article. Review.
-
Voltage-gated calcium channels of Paramecium cilia.J Exp Biol. 2016 Oct 1;219(Pt 19):3028-3038. doi: 10.1242/jeb.141234. J Exp Biol. 2016. PMID: 27707864 Free PMC article.
-
Ciliary Ca2+ pumps regulate intraciliary Ca2+ from the action potential and may co-localize with ciliary voltage-gated Ca2+ channels.J Exp Biol. 2021 May 1;224(9):jeb232074. doi: 10.1242/jeb.232074. Epub 2021 May 4. J Exp Biol. 2021. PMID: 33944932 Free PMC article.
-
Ion channels of cilia: Paramecium as a model.J Eukaryot Microbiol. 2022 Sep;69(5):e12884. doi: 10.1111/jeu.12884. Epub 2022 Jan 27. J Eukaryot Microbiol. 2022. PMID: 34995386 Review.
-
Loss of Bardet-Biedl syndrome proteins alters the morphology and function of motile cilia in airway epithelia.Proc Natl Acad Sci U S A. 2008 Mar 4;105(9):3380-5. doi: 10.1073/pnas.0712327105. Epub 2008 Feb 25. Proc Natl Acad Sci U S A. 2008. PMID: 18299575 Free PMC article.
Cited by
-
Bardet-Biedl syndrome 3 protein promotes ciliary exit of the signaling protein phospholipase D via the BBSome.Elife. 2021 Feb 15;10:e59119. doi: 10.7554/eLife.59119. Elife. 2021. PMID: 33587040 Free PMC article.
-
A Novel Role for Polycystin-2 (Pkd2) in P. tetraurelia as a Probable Mg2+ Channel Necessary for Mg2+-Induced Behavior.Genes (Basel). 2019 Jun 14;10(6):455. doi: 10.3390/genes10060455. Genes (Basel). 2019. PMID: 31207979 Free PMC article.
-
Integrative Neuroscience of Paramecium, a "Swimming Neuron".eNeuro. 2021 Jun 7;8(3):ENEURO.0018-21.2021. doi: 10.1523/ENEURO.0018-21.2021. Print 2021 May-Jun. eNeuro. 2021. PMID: 33952615 Free PMC article. Review.
-
The role of motile cilia in the development and physiology of the nervous system.Philos Trans R Soc Lond B Biol Sci. 2020 Feb 17;375(1792):20190156. doi: 10.1098/rstb.2019.0156. Epub 2019 Dec 30. Philos Trans R Soc Lond B Biol Sci. 2020. PMID: 31884916 Free PMC article. Review.
-
Paramecium, a Model to Study Ciliary Beating and Ciliogenesis: Insights From Cutting-Edge Approaches.Front Cell Dev Biol. 2022 Mar 14;10:847908. doi: 10.3389/fcell.2022.847908. eCollection 2022. Front Cell Dev Biol. 2022. PMID: 35359441 Free PMC article. Review.
References
LinkOut - more resources
Full Text Sources
Miscellaneous
