. 2013 Jan 23;77(2):251-8.
doi: 10.1016/j.neuron.2012.11.006.

Risk-responsive orbitofrontal neurons track acquired salience

Affiliations

Risk-responsive orbitofrontal neurons track acquired salience

Masaaki Ogawa et al. Neuron. .

Abstract

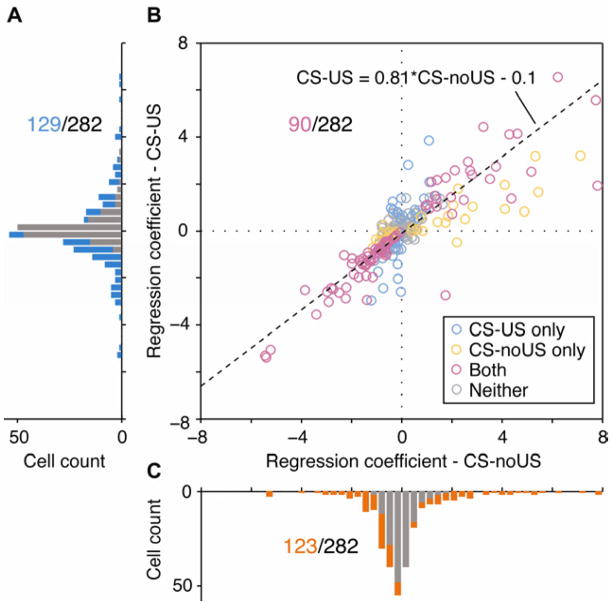
Decision making is impacted by uncertainty and risk (i.e., variance). Activity in the orbitofrontal cortex, an area implicated in decision making, covaries with these quantities. However, this activity could reflect the heightened salience of situations in which multiple outcomes-reward and reward omission-are expected. To resolve these accounts, rats were trained to respond to cues predicting 100%, 67%, 33%, or 0% reward. Consistent with prior reports, some orbitofrontal neurons fired differently in anticipation of uncertain (33% and 67%) versus certain (100% and 0%) reward. However, over 90% of these neurons also fired differently prior to 100% versus 0% reward (or baseline) or prior to 33% versus 67% reward. These responses are inconsistent with risk but fit well with the representation of acquired salience linked to the sum of cue-outcome and cue-no-outcome associative strengths. These results expand our understanding of how the orbitofrontal cortex might regulate learning and behavior.


Conflict of interest statement

The authors declare no competing financial interests.

Figures

Figure 1
Figure 1. Task design, behavior performance, and recording from the orbitofrontal cortex
a, Schematic illustrating sequence of events in the task. b, Average latency from odor offset to responding at the fluid well (***P < 0.001, Mann-Whitney U-test). c, Average number of licks during 1 s after well entry (***P < 0.001, Mann-Whitney U-test). Error bars, s.e.m. d, Raster plots and time histograms showing activity in an OFC neuron aligned to the time of response at the fluid well on trials involving 100%, 67%, 33% or 0% probability of reward. e, Recording sites in the LO (lateral orbital cortex) and AI (agranular insular cortex). Shaded boxes indicate approximate extent of recording sites. We recorded 32, 222, and 78 neurons from rats 1, 2, and 3, respectively. f, Mean firing rate of the unit shown in d as a function of reward probability. Rates were calculated during the outcome anticipation period (1 s) across the session. Error bars, s.e.m.
Figure 2
Figure 2. Risk-sensitive orbitofrontal neurons fail to conform to specific predictions for representation of risk
a, b, Time course of average peak-normalized firing rates in risk-responsive neurons ((33% and 67%) > (100% and 0%) or the opposite, respectively, P < 0.05, Mann-Whitney U-test) on trials associated with different probabilities of reward (blue, 100%; orange, 67%; red, 33%; cyan, 0%) aligned to responding at the fluid well. Shading, s.e.m.. c, d, Average firing during the outcome anticipation period (1 s) as a function of reward probability for 53 neurons shown in a and 67 neurons shown in b, respectively. Error bars, s.e.m. e, f, Distribution of activity indices contrasting average firing in anticipation of 100% versus 0% reward during the outcome anticipation period. Activity indices were calculated as follows: (firing rate in anticipation of 100% reward (“100”) – firing rate in anticipation of 0% reward (“0”))/(“100”+ “0”) for e or (“0” − “100”)/(“0” + “100”) for f (blue bar, neurons which fired significantly more in anticipation of 100% than 0% reward; cyan bar, neurons which showed the opposite pattern, P < 0.05, Mann-Whitney U-test). The distributions were shifted significantly above zero (P < 0.001, Wilcoxon signed-rank test). g, h, Distribution of activity indices contrasting average firing in anticipation of 33% versus 67% reward during the outcome anticipation period. Activity indices were calculated as follows: (firing rate in anticipation of 33% reward (“33”) – firing rate in anticipation of 67% reward (“67”))/(“33”+ “67”) for g or (“67” − “33”)/(“67” + “33”) for h (red bar, neurons which fired significantly more in anticipation of 33% than 67% reward; orange bar, neurons which showed the opposite pattern, P < 0.05, Mann-Whitney U-test). The distributions were shifted above zero (P value is from Wilcoxon signed-rank test).
Figure 3
Figure 3. The acquired salience model better explains activity of OFC neurons than the risk model
a, c, Distribution of variance in firing rate explained (adjusted R2) by addition of both the CS-noUS and CS-US regressors from the acquired salience model (a) or by addition of both the risk and CS-US regressors from the risk model (c), after the effects of behavior latencies and number of licks were accounted for (bar with orange (a) or green (c), count of neurons whose variance in firing were explained significantly (P < 0.05) by the CS-noUS (a) or the risk (c) regressor, respectively; gray bar, variance was not explained significantly; number with orange (a) or with green (c), total number of the neurons in each group). Spike counts of all task-responsive neurons were taken from the outcome anticipation period (1 s). b, Comparison of variance in firing rate explained by the CS-noUS and CS-US regressors from the acquired salience model versus the risk and CS-US regressors from the risk model (orange or green circle, a unit whose variance in firing was explained significantly only by the CS-noUS or the risk regressor, respectively; yellow circle, a unit in which variance in firing was explained significantly both by the CS-noUS and the risk regressors; gray circle, neither; number with yellow, total number of the neurons in the corresponding group). The distribution of variance explained below 0.1 is magnified. d, Distribution of the difference between variance explained by both the CS-noUS and CS-US regressors versus that explained by both the risk and CS-US regressors. The difference was calculated for each of the task-responsive neurons as follows: (variance explained by risk and CS-US - variance explained by CS-noUS and CS-US). The distribution was shifted significantly below zero (P = 3.6−10, Wilcoxon signed-rank test).
Figure 4
Figure 4. Acquired salience, reflecting the sum of CS-US and CS-noUS regressors, is the critical factor in explaining OFC neurons’ firing
a, c, Distribution of the regression coefficients of the CS-US (a) or CS-noUS (c) regressor from the acquired salience model that was fitted to the activity of each of 282 task-responsive neurons (bar with blue (a) or orange (c), count of neurons in which variance in firing were explained significantly (P < 0.05) by addition of the CS-US or the CS-noUS, respectively; gray bar, not significant). Total number of the neurons significantly explained by the CS-US (a) or the CS-noUS (c) regressor is shown with blue and orange, respectively. b, Comparison of the regression coefficients of the CS-US regressor versus that of CS-noUS regressor across all task-responsive neurons (blue or orange circle, a unit whose variance in firing was explained significantly only by the CS-US, or only by the CS-noUS, respectively; magenta circle, both; gray circle, neither; number with magenta, total number of the neurons in the corresponding group). Three units (11.22, 6.24), (11.83, 14.73), and (−18.28, −18.66) for (CS-noUS, CS-US), whose firing were explained significantly by both regressors, are not shown for visualization.
Figure 5
Figure 5. Acquired salience for different degree of reward risk or uncertainty in the study by O’Neill and Schultz (2010) or Kepecs et al (2008), respectively, simulated by the Esber-Haselgrove model
a, Simulated acquired salience for three different cues associated with three different degrees of reward risk in O’Neill and Schultz (2010) by the full Esber-Haselgrove model. In “0.27/0.33” condition, for example, a cue was equally associated with either 0.27 ml or 0.33 ml of liquid reward. Risk for the three cues associated with 0.27/0.33, 0.24/0.36, and 0.18/0.42 are 0.0009, 0.0036, and 0.0144, respectively. b, Simulated acquired salience for four different conditions defined by two different cues and two different behavioral responses in Kepecs et al (2008) by the full Esber-Haselgrove model. “Correct, 44/56”, for example, denotes the condition in which subjects made correct response to obtain liquid reward after presentation of a mixed odor consisting of 44% of odor A and 56% of odor B.

References

    1. Bach DR, Dolan RJ. Knowing how much you don’t know: a neural organization of uncertainty estimates. Nature Reviews Neuroscience. 2012;13:572–586. - PubMed
    1. Chase EA, Tait DS, Brown VJ. Lesions of the orbital prefrontal cortex impair the formation of attentional set in rats. European Journal of Neuroscience. 2012;36:2368–2375. - PubMed
    1. Corlett PR, Murray GK, Honey GD, Aitken MR, Shanks DR, Robbins TW, Bullmore ET, Dickinson A, Fletcher PC. Disrupted prediction-error signal in psychosis: evidence for an associative account of delusions. Brain. 2007;130:2387–2400. - PMC - PubMed
    1. D’Acremont M, Bossaerts P. Neurobiological studies of risk assessment: a comparison of expected utility and mean-variance approaches. Cognitive, Affective, & Behavioral Neuroscience. 2008;8:363–374. - PubMed
    1. Esber GR, Haselgrove M. Reconciling the influence of predictiveness and uncertainty on stimulus salience: a model of attention in associative learning. Proceedings of the Royal Society B. 2011;278:2553–2561. - PMC - PubMed

Publication types

LinkOut - more resources