. 2013 Jan 23;77(2):323-34.
doi: 10.1016/j.neuron.2012.11.005.

Synaptic vesicles position complexin to block spontaneous fusion

Affiliations

Synaptic vesicles position complexin to block spontaneous fusion

Rachel T Wragg et al. Neuron. .

Abstract

Synapses continually replenish their synaptic vesicle (SV) pools while suppressing spontaneous fusion events, thus maintaining a high dynamic range in response to physiological stimuli. The presynaptic protein complexin can both promote and inhibit fusion through interactions between its α-helical domain and the SNARE complex. In addition, complexin's C-terminal half is required for the inhibition of spontaneous fusion in worm, fly, and mouse, although the molecular mechanism remains unexplained. We show here that complexin's C-terminal domain binds lipids through a novel protein motif, permitting complexin to inhibit spontaneous exocytosis in vivo by targeting complexin to SVs. We propose that the SV pool serves as a platform to sequester and position complexin where it can intercept the rapidly assembling SNAREs and control the rate of spontaneous fusion.


Figures

Figure 1
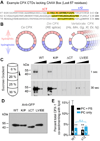
Figure 1. CPX-1 binds phospholipids through a conserved C-terminal amphipathic region
A. Alignments of the last 57 amino acids from worm (Ce), fly splice variant cpx-RE (Dm), and mouse (Mm) complexin 1 with the amphipathic region highlighted (yellow). ΔCT (red) indicates residues 94–143 deleted in the ΔCT CPX-1 construct and Δ12 (blue) indicates residues 132–143 deleted in the Δ12 CPX-1 construct. Substituted residues in this study are indicated in red. B. Helical wheel diagrams of the amphipathic region for worm, fly, and six vertebrate complexin 1 orthologs: human (Hs), mouse (Mm), chicken (Gg), Xenopus (Xl), zebrafish (Dr), and skate (Nj). Hydrophilic residues are in red, hydrophobic in blue. C. Liposome flotation in a sucrose gradient for pGFP-tagged full-length (WT), K123P (K/P), CTD truncation (ΔCT), and L117E, V121E (LV/EE). The top three fractions were collected, and floating CPX-1::pGFP was detected by Western blot using an anti-GFP antibody. Loading controls displayed on Western blot using anti-GFP (D). E. Percent co-sedimentation of either full-length CPX-1::pGFP or Δ12::pGFP with either 100% phosphatidylcholine (PC) liposomes (blue) or 70% PC + 30% phosphatidylserine (PS) liposomes (black) was quantified across several experiments (see Experimental Procedures and Figure S1). Data are mean ± SEM and ** denotes significantly different from full length CPX-1 with PC/PS liposomes (p < 0.01) using Tukey-Kramer method.
Figure 2
Figure 2. NMR spectroscopy reveals an interaction between phospholipids and CTD residues of CPX-1
A. HSQC peak intensity ratio (with/without lipid) is plotted for each residue of CPX-1 for which a resonance could be well-resolved (see Figure S2 for spectrum). Ratios were computed for matched spectra collected at four lipid concentrations as indicated. The amphipathic region is boxed and residues 132–143 deleted in the Δ12 CPX-1 construct are indicated in blue. Substituted residues in this study are indicated in red. B. HSQC resonance ratios were averaged over resolvable peaks in the last 34 residues for wild-type full-length CPX-1(black) and the LV/EE variant (red), or Δ12 (blue) for increasing phospholipid/protein ratio (computed as the molar ratio of total phospholipid to total protein). C. Helical wheel model for the amphipathic region with L117 and V121 indicated (asterisks). D. Cartoon of the three CPX-1 constructs for which spectra were obtained.
Figure 3
Figure 3. Lipid-binding regions of the CTD are critical for the inhibitory function of CPX-1 in vivo
A. Cartoon schematics of the six CPX-1 variants used in these functional studies. B. Paralysis time course on 1 mM aldicarb for wild-type (black circles), cpx-1 (gray diamonds), full-length rescue CPX-GFP (open circles), and a C-terminal truncation ΔCT-GFP (gray triangles). C. Percentage of animals paralyzed on 1 mM aldicarb after 50 minutes for wild-type, cpx-1 mutant, and transgenic animals expressing CPX-1 variants as indicated. D. Examples of spontaneous EPSCs for wild-type, cpx-1, and transgenic animals expressing CPX-1 variants as indicated. Average spontaneous (zero external calcium) EPSC Rate (E) and EPSC amplitude (F) for the genotypes indicated in D. Data are mean ± SEM and the number of independent assays is indicated for each genotype. * denotes significantly different from wild-type (p < 0.01) but not significantly different from cpx-1. ** denotes significantly different from both wild type and cpx-1. # denotes no significant difference from wild type. Significance was determined by Tukey-Kramer method.
Figure 4
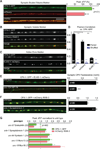
Figure 4. CPX-1 colocalizes with synaptic vesicles at the NMJ
A. Fluorescent images of the dorsal nerve cord expressing CPX-1::GFP (top), soluble mCherry (middle), and merged image (bottom). Scale bar is 5 microns. Average synaptic enrichment, quantified as 100·(Fpeak−Faxon)/Faxon for CPX-1::GFP (green) and soluble mCherry (red) is shown on the right. B. Fluorescent images of the dorsal nerve cord expressing CPX-1::GFP (top), mCherry::RAB-3 (middle), and merged image (bottom). C. Dorsal nerve cord expressing CPX-1::GFP (top), ELKS-1::mCherry (middle), and merged (bottom). D. Average Pearson correlation values for pair-wise comparisons of CPX-1::GFP fluorescence with mCherry::RAB-3, soluble mCherry, and ELKS-1::mCherry. For each comparison, a shuffled dataset was also computed to determine the extent of random correlation between images (see Experimental Procedures). E. Dorsal nerve cord expressing CPX-1::GFP and ELKS-1::mCherry in wild-type (top) and unc-104 KIF-1A mutant (bottom). Average synaptic CPX-1::GFP fluorescence intensity for wild-type and unc-104 mutants normalized to the wild-type value is shown on the right. F. Dorsal nerve cord expressing CPX-1::GFP mCherry::RAB-3 in wild-type (top) and snb-1 synaptobrevin mutant (bottom). Average synaptic CPX-1::GFP fluorescence intensity for wild-type and snb-1 mutants normalized to the wild-type value is shown on the right. G. Average synaptic enrichment of CPX-1::GFP (green) and mCherry::RAB-3 (red) is shown for unc-57(e406) endophilin, unc-64(e246) syntaxin 1, unc-13(s69), and unc-18(e81) mutants normalized to wild-type (dashed line and error bars for CPX-1::GFP in green, mCherry::RAB-3 in red, n=60). Data are mean ± SEM. Number of nerve cord images is indicated in or next to the bar for each measurement. ** denotes significant difference with p < 0.01 using the Tukey-Kramer method in D, or Student’s t test in A, E, and F.
Figure 5
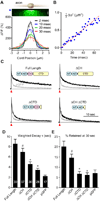
Figure 5. CPX-1 is retained at synapses primarily through its CTD
A. Kymograph of successive line scans following photoactivation of CPX-pGFP (arrowhead) at a single synapse (single trial). Scale bar is 10 msec. Profiles of individual linescans collected after photo-activation at the times indicated (thin traces) were fitted with Gaussians (thick traces). B. Increase in variance of fit is plotted versus time and fitted to a line (red) to estimate diffusion (see Experimental Procedures). C. Normalized time course of synaptic fluorescence is shown for four CPX-1 variants (black) along with pGFP alone (gray) for comparison. Cartoons of the CPX-1 variants are included for each example time course with protein domains NT (N-terminal domain), AD (accessory domain), CH (central helix) and CTD (C-terminal domain). Activation of pGFP is indicated by the arrowhead. D. The weighted decay time constant following a double exponential fit (see Experimental Procedures) is shown for each of the five pGFP constructs. E. The percent fluorescence remaining after 30 sec. Data are mean ± SEM with number of synapses indicated within bars. * denotes significantly different from full-length (p < 0.01) but not significantly different from pGFP. # denotes no significant difference from full-length. Significance was determined by Tukey-Kramer method.
Figure 6
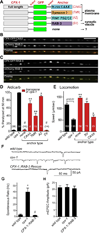
Figure 6. CPX-1 functions optimally when anchored to the vesicle rather than the plasma membrane
A. Schematic of four anchored full-length CPX-1 constructs expressed in cpx-1 mutants. K-ras CAAX = last 23 residues of worm let-60 K-ras. Syntaxin 1 = full-length unc-64 Syntaxin 1. RIM1 PDZ/C2 = 500 amino acid fragment of unc-10 RIM1. RAB-3 = full-length rab-3. B. Dorsal nerve cord expressing CPXCAAX and mCherry::RAB-3. Scale bar is 5 microns. C. Dorsal nerve cord expressing CPXSV and mCherry::RAB-3. D. Percentage of animals paralyzed at 50 minutes on 1 mM aldicarb for wild-type, cpx-1, and five rescue transgenic animals expressing CPX-1 with various anchors as indicated. E. Average speed for wild-type, cpx-1, and rescue transgenic animals with anchored CPX-1. F. Example spontaneous fusion events (at zero external calcium) for wild-type, cpx-1, and cpx-1 mutants rescued with RAB-3-anchored CPX-1. Average fusion rates (G) and mEPSC amplitudes (H) for the three genotypes in F. Data are mean ± SEM with number of experiments for aldicarb and number of animals for locomotion indicated. * denotes significantly different from wild-type (p < 0.01) but not significantly different from cpx-1. ** denotes significantly different from both wild-type and cpx-1. # denotes no significant difference from wild-type. Significance was determined by Tukey-Kramer method. Wild-type cpx-1, and full-length rescue aldicarb and electrophysiological data are the same data set shown in Figure 3.
Figure 7
Figure 7. SV-tethering bypasses the requirement for the CTD
A. Cartoon of two rescue constructs expressed in cpx-1 mutants interacting with the trans-SNARE and membrane. In both constructs, the last 50 residues of the CTD have been removed and the remaining N-terminal half of CPX-1 has been fused to GFP and a membrane anchor. The CAAX anchor (left) and SV anchor (right) are described in Figure 6. CH is the central helix. B. Time course of paralysis in 1 mM aldicarb for wild-type animals (black) and three transgenic strains expressing the following CPX-1 variants: ΔCT (red circles), ΔCT-SV (green squares), and ΔCT-CAAX (blue triangles). C. Percentage paralysis at 50 minutes for the transgenics shown in B as well as cpx-1, full length rescue (FL), and the amphipathic mutation LV/EE fused to RAB-3 (LV/EE-SV). Data are mean ± SEM with number of experiments for aldicarb indicated on the bar graph. ** Significantly different from cpx-1 and wild type (p<0.01). * denotes significantly different from wild-type (p < 0.01) but not significantly different from cpx-1. # denotes no significant difference from wild-type. Significance was determined by Tukey-Kramer method. Wild-type cpx-1, and full-length rescue aldicarb and electrophysiological data are the same data set shown in Figure 3.

References

    1. Ashery U, Bielopolski N, Barak B, Yizhar O. Friends and foes in synaptic transmission: the role of tomosyn in vesicle priming. Trends Neurosci. 2009;32:275–282. - PMC - PubMed
    1. Bracher A, Kadlec J, Betz H, Weissenhorn W. X-ray structure of a neuronal complexin-SNARE complex from squid. J Biol Chem. 2002;277:26517–26523. - PubMed
    1. Brose N. For Better or for Worse: Complexins Regulate SNARE Function and Vesicle Fusion. Traffic. 2008 - PubMed
    1. Burbea M, Dreier L, Dittman JS, Grunwald ME, Kaplan JM. Ubiquitin and AP180 regulate the abundance of GLR-1 glutamate receptors at postsynaptic elements in C. elegans. Neuron. 2002;35:107–120. - PubMed
    1. Chen X, Tomchick DR, Kovrigin E, Arac D, Machius M, Sudhof TC, Rizo J. Three-dimensional structure of the complexin/SNARE complex. Neuron. 2002;33:397–409. - PubMed

Publication types

MeSH terms

Substances

LinkOut - more resources