. 2013 Feb 21;38(2):250-62.
doi: 10.1016/j.immuni.2012.10.017. Epub 2013 Jan 24.

CDK8 kinase phosphorylates transcription factor STAT1 to selectively regulate the interferon response

Affiliations

CDK8 kinase phosphorylates transcription factor STAT1 to selectively regulate the interferon response

Joanna Bancerek et al. Immunity. .

Abstract

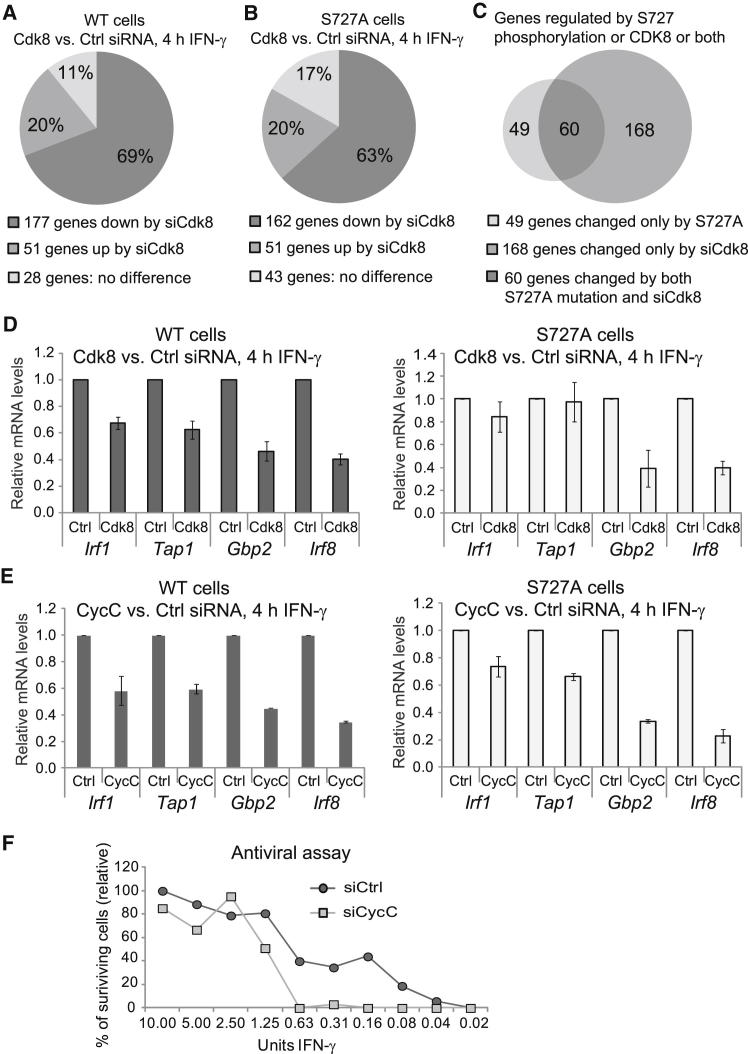
Gene regulation by cytokine-activated transcription factors of the signal transducer and activator of transcription (STAT) family requires serine phosphorylation within the transactivation domain (TAD). STAT1 and STAT3 TAD phosphorylation occurs upon promoter binding by an unknown kinase. Here, we show that the cyclin-dependent kinase 8 (CDK8) module of the Mediator complex phosphorylated regulatory sites within the TADs of STAT1, STAT3, and STAT5, including S727 within the STAT1 TAD in the interferon (IFN) signaling pathway. We also observed a CDK8 requirement for IFN-γ-inducible antiviral responses. Microarray analyses revealed that CDK8-mediated STAT1 phosphorylation positively or negatively regulated over 40% of IFN-γ-responsive genes, and RNA polymerase II occupancy correlated with gene expression changes. This divergent regulation occurred despite similar CDK8 occupancy at both S727 phosphorylation-dependent and -independent genes. These data identify CDK8 as a key regulator of STAT1 and antiviral responses and suggest a general role for CDK8 in STAT-mediated transcription. As such, CDK8 represents a promising target for therapeutic manipulation of cytokine responses.


Figures

Figure 1
Figure 1
Canonical Cytokine-Induced TAD Phosphorylation of STAT1, STAT3, STAT4, and STAT5 Is Inhibited by Flavopiridol (A) BMDMs were stimulated for 40 min with IFN-γ or IFN-β after pretreatment or control treatment for 15 min with flavopiridol (FP) (500 nM). Cell extracts were analyzed by immunoblotting with antibodies against phosphorylated STAT1 at S727 (pS727-STAT1) or Y701 (pY701-STAT1) and against total STAT1. Note the presence of two bands detected by the pY701-STAT1 antibody; they represent pY701 of STAT1α and STAT1β isoforms, which are both expressed in BMDMs. STAT1β has Y701 but lacks the TAD (including S727). (B) Human HepG2 cells were stimulated for 30 min with IFN-γ or IL-6 after a 15 min pretreatment with FP. Cell extracts were analyzed as in (A). (C) BMDMs were stimulated for 40 min with IFN-γ after a 15 min pretreatment with FP, olomoucine (Olo), or roscovitine (Rosc). Cell extracts were analyzed as in (A). (D) BMDMs were stimulated for 40 min with LPS or IFN-γ after a 15 min pretreatment with FP. Cell extracts were analyzed as in (A). (E) Sequence alignment of STAT C termini comprising the TADs of STAT1, STAT3, STAT4, and STAT5a. The conserved P(M)SP motif containing the serine residue phosphorylated upon cytokine stimulation is highlighted. (F) BMDMs were stimulated for 40 min with LPS, IFN-β, or IL-10 after pretreatment or control treatment for 15 min with FP. Cell extracts were immunoprecipitated with antibodies against STAT3 and were subsequently analyzed by immunoblotting with antibodies against phosphorylated STAT3 at S727 (pS727-STAT3) or Y705 (pY705-STAT3) and against total STAT3. (G) Mouse splenocytes were stimulated for 40 min with IL-12 or IFN-β after pretreatment or control treatment for 15 min with FP. Cell extracts were analyzed by immunoblotting with antibodies against phosphorylated STAT4 at S722 (pS722-STAT4) or Y694 (pY694-STAT4) and against total STAT4. (H) BMDMs were stimulated for 40 min with GM-CSF after pretreatment or control treatment for 15 min with FP. Cell extracts were analyzed by immunoblotting with antibodies against STAT5a phosphorylated at S725 (corresponding to S730 in STAT5b) or Y694 (Y699 in STAT5b) and against total STAT5. See also Figure S1.
Figure 2
Figure 2
CDK8 Phosphorylates S727 of STAT1 in IFN-γ Response (A) Treatment of mouse fibroblasts with siRNA to Cdk7, Cdk8, and Cdk9 resulted in the reduction of the corresponding protein levels. Control siCtrl (Ctrl) had no effect. Fibroblasts were treated for 48 hr with their respective siRNA, and the protein amounts of CDK7, CDK8, or CDK9 were subsequently detected by immunoblotting. Antibodies against ERK1 and ERK2 (panERK) were used for the loading control. (B) Silencing of Cdk8 reduced IFN-γ-induced STAT1 S727 phosphorylation. Fibroblasts silenced for the expression of Cdk7, Cdk8, or Cdk9 were treated for 40 min with IFN-γ or were left untreated. Cell extracts were analyzed by immunoblotting with antibodies against phosphorylated STAT1 at S727 (pS727-STAT1) or Y701 (pY701-STAT1) and against total STAT1. (C and D) The CDK8 module phosphorylated the STAT1 TAD in vitro at S727. (C) Kinase assays using the CDK8 module, TFIIH, and P-TEFb kinase complexes with STAT1 TAD (STAT1 WT), STAT1 TAD with the S727A alteration (STAT1 S727A), or RNAPII C-terminal domain (Pol II CTD) as substrates. Note that all kinase substrates have an N-terminal GST tag. The autorad image and silver-stained loading reference are shown for each substrate. (D) Quantitation of kinase activity for the CDK8 module (CDK8), TFIIH, and P-TEFb against STAT1 WT and STAT1 S727A. All activities were standardized to the CDK8 STAT1 WT autorad signal (100). Asterisks denote signals that could not be integrated above the background signal; these were given a relative activity of zero. Shown are representative data from two independent experiments for each kinase. All quantitation was done with ImageJ. (E) Silencing of Cdk8 with siCdk8 (left panel) and Ccnc with CycC (right panel) resulted in a similar reduction of IFN-γ-induced STAT1 S727 phosphorylation. siCdk8- or siCycC-silenced mouse embryonic fibroblasts (MEFs) or control (ctrl)-silenced cells were treated for 20 or 40 min with IFN-γ or were left untreated. Cell extracts were analyzed as in (B). (F) Kinase assays using the CDK8 module, TFIIH, and P-TEFb complexes against substrates STAT3 TAD (S3 WT), S727A STAT3 TAD (S3 S727A), STAT5a TAD (S5 WT), S725A STAT5a TAD (S5 S725A), S779A STAT5a TAD (S5 S779A), and S725A-S779A STAT5a TAD (S5 S725/S779A). All kinase substrates have an N-terminal GST tag. The autorad image and silver-stained loading reference are shown for each substrate. (G) Quantitation of kinase activity (obtained with ImageJ) for the CDK8 module against STAT3 and STAT5a TADs and the corresponding mutants described in (F). The activities were standardized at 100% for STAT3 WT or STAT5a WT. Error bars represent SDs (n = 3). (H) Silencing of Cdk8 reduced IFN-β-induced STAT3 S727 phosphorylation. Cdk8-silenced fibroblasts were treated for 40 min with IFN-β or were left untreated. Cell extracts were immunoprecipitated with STAT3 antibodies and analyzed by immunoblotting with antibodies against phosphorylated STAT3 at S727 (pS727-STAT3) or Y705 (pY701-STAT3) and against total STAT3. See also Figure S2.
Figure 3
Figure 3
CDK8 Recruitment to IFN-γ Target Genes Requires STAT1 and Depends on S727 (A) CDK8 recruitment is dependent on IFN-γ (left panel) and STAT1 (right panel). WT MEFs (left panel) or WT and Stat1−/− MEFs (right panel) were treated with IFN-γ, and CDK8 recruitment to the Irf1 TSS was determined by ChIP. CDK8 was slowly recruited with peak appearance after 30 min of stimulation (left panel). No increase of CDK8 was detected at Irf1 in Stat1−/− MEFs (right panel). Immunoprecipitated DNA was analyzed by qPCR for the Irf1 TSS. Signals were normalized to input DNA. Error bars represent SDs (n = 3). (B) STAT1 recruitment (left panel) and slower increase in S727-phosphorylated STAT1 occupancy at the Irf1 promoter (right panel). WT MEFs were treated with IFN-γ, and STAT1 (left panel) or S727-phosphorylated STAT1 (right panel) at the Irf1 promoter was determined by ChIP. Signals were normalized to input DNA. Error bars represent SDs (n = 3). (C) CDK8 was recruited to Irf1 (left panel) and Gbp2 (right panel); the STAT1 S727A alteration reduced CDK8 recruitment to both genes. STAT1 WT and STAT1 S727A MEFs were treated with IFN-γ. The association between CDK8 and the Irf1 and Gbp2 TSSs was examined by ChIP. Signals were normalized to input DNA. Error bars represent SDs (n = 3). (D) The STAT1 WT and the S727A mutant were similarly recruited to the IFN-γ-regulated promoters. WT and S727A MEFs were treated for 1 hr with IFN-γ or were left untreated. The association between STAT1 and the Irf1 and Gbp2 promoters was examined by ChIP. Immunoprecipitated DNA was analyzed by qPCR for the Irf1 and Gbp2 promoters (comprising the GAS elements). Signals were normalized to input DNA. Error bars represent SDs (n = 3). (E) CDK8 was less efficiently recruited by STAT1β than by STAT1α. MEFs derived from mice expressing solely STAT1α or STAT1β were treated with IFN-γ. The association between CDK8 and the Irf1 and Gbp2 TSSs was examined by ChIP as in (C). Error bars represent SDs (n = 3). See also Figure S3.
Figure 4
Figure 4
CDK8-Mediated STAT1 S727 Phosphorylation Is Required for Balanced Induction of IFN-γ-Regulated Genes (A) Out of 256 IFN-γ-induced genes, 61 were less expressed and 48 were more expressed in the absence of S727 phosphorylation. WT and S727A MEFs were stimulated for 4 hr with IFN-γ or were left untreated. mRNA from three biological replicates was analyzed with microarrays. First, genes significantly (p value < 0.05) induced at least 2-fold by IFN-γ were selected. Expression of these genes was compared between WT and S727A cells. At least 2-fold different expression (p value < 0.05) was found for 109 genes, 61 of which displayed lower expression and 48 of which higher expression in S727A cells. (B) qRT-PCR validation of microarray data. WT and S727A MEFs were stimulated for 2 and 4 hr with IFN-γ or were left untreated. mRNA of Irf1, Tap1, Gbp2, Irf8, and Isg15 was analyzed by qRT-PCR. Irf1 was equally expressed, expression of Tap1, Gbp2, and Irf8 was reduced, and Isg15 expression was higher in S727A cells. Error bars display SDs of biological replicates (n = 3). See also Tables S1–S4.
Figure 5
Figure 5
Detection of IFN-γ-Induced Gene Expression in WT and S727A Cells by Analysis of Newly Transcribed RNA 4sU was added to the cell-culture medium simultaneously with IFN-γ, 60 and 210 min after IFN-γ stimulation, or without IFN-γ treatment. Labeling was performed in WT and S727A MEFs for 30 min and was followed by RNA isolation and separation for the collection of the 4sU-labeled RNA fractions and total RNA fractions. The labeled RNA fractions represented RNA that was synthesized during a 30 min interval before stimulation of cells, as well as in the periods 0–30 min, 60–90 min, and 210–240 min after IFN-γ treatment. The amount of Irf1, Tap1, Gbp2, Irf8, and Isg15 mRNA was measured in the labeled (i.e., newly synthesized) fractions by qRT-PCR. ActB was used for normalization. Error bars represent SDs (n = 3). See also Figure S4.
Figure 6
Figure 6
STAT1 S727 Phosphorylation Controls Chromatin Recruitment of RNAPII and S2-Phosphorylated RNAPII in a Gene-Specific Manner (A) Association between RNAPII and the TSSs of Irf1, Tap1, and Gbp2 in WT and S727A MEFs treated for 1 and 2 hr with IFN-γ was examined by ChIP with RNAPII antibodies. Immunoprecipitated DNA was analyzed by qPCR for the Irf1, Gbp2, and Tap1 TSSs. Signals were normalized to input DNA. Error bars represent SDs (n = 3). (B and C) Association between RNAPII and S2-phosphorylated RNAPII and the gene body (intron 8) of Irf1 (B) and the gene body (intron 5) of Tap1 (C) in WT and S727A MEFs treated for 1 and 2 hr with IFN-γ was examined by ChIP with antibodies against RNAPII (left panels) and pS2-RNAPII (middle panels). Immunoprecipitated DNA was analyzed by qPCR for Irf1 intron 8 and Tap1 intron 5. Signals were normalized to input DNA. Error bars represent SDs (n = 3). Right panels depict the ratios of pS2-RNAPII to total RNAPII. See also Figure S5.
Figure 7
Figure 7
The CDK8 Module Regulates Most IFN-γ-Induced Genes and Impairs Antiviral Response (A and B) Most IFN-γ-induced genes were downregulated by Cdk8 silencing in both STAT1 WT and S727A cells. STAT1 WT (A) or S727A (B) MEFs were treated with siCdk8 or siCtrl and were stimulated for 4 hr with IFN-γ or were left untreated. mRNA from three biological replicates was analyzed with microarrays. Out of 256 IFN-γ-induced genes, 177 (69%) were less expressed in WT STAT1 cells treated with siCdk8 than in siCtrl treated cells (A). In STAT1 S727A cells, 162 genes (63%) were less expressed by siCdk8 (B). The numbers were extracted from Table S4. (C) Overlap of genes similarly regulated by S727 phosphorylation and CDK8. The left circle shows IFN-γ-induced genes that were significantly changed (upregulated or downregulated) in S727A cells. The right circle shows IFN-γ-induced genes that changed (upregulated or downregulated) upon Cdk8 silencing in WT cells. The overlap depicts genes (60 in total) that were either downregulated or upregulated by both the S727A alteration and Cdk8 silencing. The numbers were extracted from Table S4. (D) Validation of microarray data. WT or S727A MEFs treated with siCdk8 or siCtrl were stimulated for 4 hr with IFN-γ or were left unstimulated, and mRNA for Irf1, Tap1, Gbp2, and Irf8 was analyzed by qRT-PCR. For each gene, mRNA was normalized to Hprt mRNA and standardized to 1.0 for the siCtrl-treated samples. Error bars display SDs of biological replicates (n = 3). (E) The effect of Ccnc silencing (with siCycC) on IFN-γ-regulated genes was similar to that of Cdk8 silencing. WT or S727A MEFs treated with siCycC or siCtrl were stimulated for 4 hr with IFN-γ or were left unstimulated. mRNA for Irf1, Tap1, Gbp2, and Irf8 was analyzed by qRT-PCR. For each gene, mRNA was normalized to Hprt mRNA and standardized to 1.0 for the siCtrl-treated samples. Error bars represent SDs (n = 3). (F) Silencing of Ccnc with siCycC resulted in increased sensitivity of cells to VSV infection. STAT1 WT cells were treated with siCycC or siCtrl and were incubated with IFN-γ at the indicated concentrations. After 24 hr of IFN-γ treatment, cells were infected with vesicular stomatitis virus (VSV) (multiplicity of infection = 0.1) for 39 hr. Cell survival was then evaluated with crystal-violet staining. Mean crystal-violet values of duplicate experiments are shown. See also Figure S6 and Table S5.

References

    1. Akoulitchev S., Chuikov S., Reinberg D. TFIIH is negatively regulated by cdk8-containing mediator complexes. Nature. 2000;407:102–106. - PubMed
    1. Alarcón C., Zaromytidou A.I., Xi Q., Gao S., Yu J., Fujisawa S., Barlas A., Miller A.N., Manova-Todorova K., Macias M.J. Nuclear CDKs drive Smad transcriptional activation and turnover in BMP and TGF-beta pathways. Cell. 2009;139:757–769. - PMC - PubMed
    1. Alessi F., Quarta S., Savio M., Riva F., Rossi L., Stivala L.A., Scovassi A.I., Meijer L., Prosperi E. The cyclin-dependent kinase inhibitors olomoucine and roscovitine arrest human fibroblasts in G1 phase by specific inhibition of CDK2 kinase activity. Exp. Cell Res. 1998;245:8–18. - PubMed
    1. Balamotis M.A., Pennella M.A., Stevens J.L., Wasylyk B., Belmont A.S., Berk A.J. Complexity in transcription control at the activation domain-mediator interface. Sci. Signal. 2009;2 ra20. - PMC - PubMed
    1. Chao S.H., Price D.H. Flavopiridol inactivates P-TEFb and blocks most RNA polymerase II transcription in vivo. J. Biol. Chem. 2001;276:31793–31799. - PubMed

Publication types

MeSH terms

Associated data