. 2013 Mar 15;46(5):863-70.
doi: 10.1016/j.jbiomech.2012.12.024. Epub 2013 Jan 24.

Viscoelastic properties of the ferret brain measured in vivo at multiple frequencies by magnetic resonance elastography

Affiliations

Viscoelastic properties of the ferret brain measured in vivo at multiple frequencies by magnetic resonance elastography

Y Feng et al. J Biomech. .

Abstract

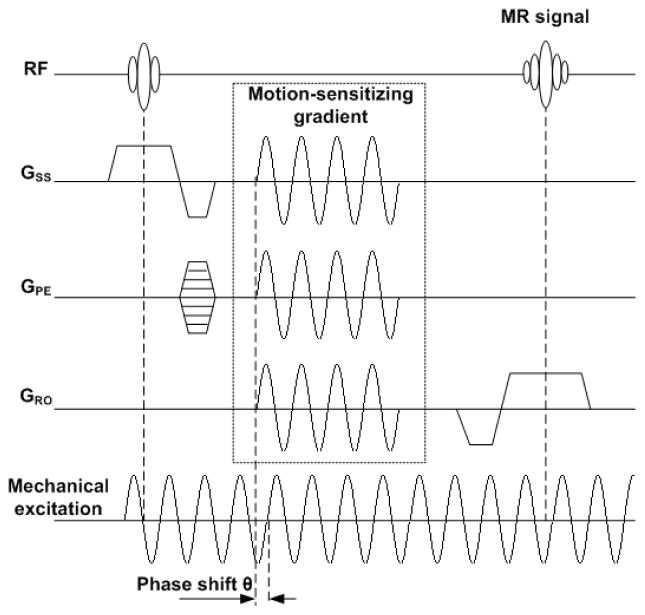
Characterization of the dynamic mechanical behavior of brain tissue is essential for understanding and simulating the mechanisms of traumatic brain injury (TBI). Changes in mechanical properties may also reflect changes in the brain due to aging or disease. In this study, we used magnetic resonance elastography (MRE) to measure the viscoelastic properties of ferret brain tissue in vivo. Three-dimensional (3D) displacement fields were acquired during wave propagation in the brain induced by harmonic excitation of the skull at 400 Hz, 600 Hz and 800 Hz. Shear waves with wavelengths in the order of millimeters were clearly visible in the displacement field, in strain fields, and in the curl of displacement field (which contains no contributions from longitudinal waves). Viscoelastic parameters (storage and loss moduli) governing dynamic shear deformation were estimated in gray and white matter for these excitation frequencies. To characterize the reproducibility of measurements, two ferrets were studied on three different dates each. Estimated viscoelastic properties of white matter in the ferret brain were generally similar to those of gray matter and consistent between animals and scan dates. In both tissue types G' increased from approximately 3 kPa at 400 Hz to 7 kPa at 800 Hz and G″ increased from approximately 1 kPa at 400 Hz to 2 kPa at 800 Hz. These measurements of shear wave propagation in the ferret brain can be used to both parameterize and validate finite element models of brain biomechanics.


Conflict of interest statement

Conflict of interest statement

None of the authors has a conflict of interest that could influence the work described in this manuscript.

Figures

Figure 1
Figure 1
(a) Setup for inducing and imaging mechanical waves in the ferret brain. The piezoelectric actuator generates mechanical vibration at frequencies of 400, 600, and 800 Hz, which was transmitted through the bite bar to the teeth. The teeth were pre-loaded against the bite bar by adjusting the nose cone position. The RF coil served as both the transmitting and receiving coil for MRI. (b) Schematic view showing the position detail of actuator, bite bar, and nose cone. The direction of actuation is along the long axis of the bite bar, which is anterior-posterior with respect to the skull.
Figure 2
Figure 2
Gradient-echo multi-slice (GEMS) magnetic resonance elastography (MRE) sequence. The motion encoding gradient can be applied in any or all of the three directions in Cartesian coordinates. The phase shift θ between the mechanical excitation and the motion encoding gradient was chosen to be either [0, π/2, π, 3π/2], or [0, π/4, π/2, 3π/4, π, 5π/4, 3π/2, 7π/4] within one sinusoidal excitation cycle.
Figure 3
Figure 3
(a) Transverse view, (b) coronal view, and (c) sagittal view of ferret brain anatomy images (spin echo; T2-weighted; TR=4000 ms; TE=25 ms) showing the field of view (FOV) with a voxel size of 0.25 mm × 0.25 mm × 0.25 mm. The dashed white lines on each view indicate the position of the orthogonal planes.
Figure 4
Figure 4
Eleven coronal image slices obtained in ferret F2 by a standard gradient echo multi-slice (GEMS) imaging sequence. TR=500 ms; TE=20 ms. The same image slices were used in MRE. The FOV is 36 mm × 36 mm with a pixel size of 0.5 mm × 0.5 mm. The slice thickness was 0.5 mm with no gap between each slice.
Figure 5
Figure 5
Displacement fields at (a) 400 Hz and (b) 600 Hz actuator frequencies. Four phases of the periodic motion (0,π/2,π,3π/2) are shown in sequence from left to right. Three displacement components in x (left-right), y (inferior-superior), and z (anterior-posterior) directions in Cartesian coordinates are shown. Panel (a) above is from ferret F2, at a slice position corresponding to slice 2 in Fig. 4. Panel (b) is from an analogous brain section in ferret F1.
Figure 6
Figure 6
Curl fields ω = ∇ × u. The ωx, ωy, and ωz components are shown at four temporal points in one motion cycle at (a) 400 Hz (ferret F2, slice position corresponding to slice 2, Fig. 4) and (b) 600 Hz (ferret F1).
Figure 7
Figure 7
Example storage (G′) and loss (G″) modulus estimates for (a, d) 400 Hz, (b, e) 600 Hz and (c, f) 800 Hz actuation frequency for posterior sections in two ferrets. (a–c) ferret F2 (slice position corresponding to slice 2 of Fig. 4). (d–f) ferret F1. White outlines indicate the region over which modulus estimates were attempted. Estimates were based on fitting of curl fields to Eq. 8, and were rejected if the normalized residual error (NRE) of fitting exceeded 0.50.
Figure 8
Figure 8
(a–f) Estimated viscoelastic parameters (mean ± std. dev. storage modulus, G′, and loss modulus, G″) of white matter (white bars) and gray matter (gray bars) at 400 Hz, 600 Hz, and 800 Hz. Statistics were computed over all voxels in segmented elastograms in consistent anterior and posterior brain regions in ferret F1, and ferret F2 on each of three different scan dates for each ferret. (g, h) Summary of storage and loss moduli (mean and std. dev. of mean values from all dates) for each ferret at each frequency. (i) Example segmentation of white matter (WM, red ) and gray matter (GM, green) for one ferret brain section (ferret F2, slice position corresponding to slice 2 of Fig. 4).
Figure 9
Figure 9
Octahedral shear strain (εs) and volumetric strain (εn) for (a, d) 400 Hz, (b, e) 600 Hz and (d, f) 800 Hz in image slices corresponding to elastograms in Fig. 7. (a–c) Ferret F2. (d–f) Ferret F1. The octahedral shear strain reflects the magnitude of shear deformation and thus the effective contrast-to-noise-ratio (CNR) of MRE measurements.

References

    1. Asbach P, Klatt D, Hamhaber U, Braun J, Somasundaram R, Hamm B, Sack I. Assessment of liver viscoelasticity using multifrequency MR elastography. Magn Reson Med. 2008;60:373–379. - PubMed
    1. Atay SM, Kroenke CD, Sabet A, Bayly PV. Measurement of the dynamic shear modulus of mouse brain tissue in vivo by magnetic resonance elastography. J Biomech Eng. 2008;130:21013. - PMC - PubMed
    1. Auld BA. Acoustic fields and waves in solids. 2. R.E. Krieger; Malabar, FL: 1990.
    1. Barnette AR, Neil JJ, Kroenke CD, Griffith JL, Epstein AA, Bayly PV, Knutsen AK, Inder TE. Characterization of brain development in the ferret via MRI. Pediatr Res. 2009;66:80–84. - PMC - PubMed
    1. Boulet T, Kelso ML, Othman SF. Microscopic magnetic resonance elastography of traumatic brain injury model. J Neurosci Methods. 2011;201:296–306. - PubMed

Publication types