. 2013 Jan 31;3(1):116-27.
doi: 10.1016/j.celrep.2012.12.016. Epub 2013 Jan 24.

RUNX1 is a key target in t(4;11) leukemias that contributes to gene activation through an AF4-MLL complex interaction

Affiliations

RUNX1 is a key target in t(4;11) leukemias that contributes to gene activation through an AF4-MLL complex interaction

Adam C Wilkinson et al. Cell Rep. .

Abstract

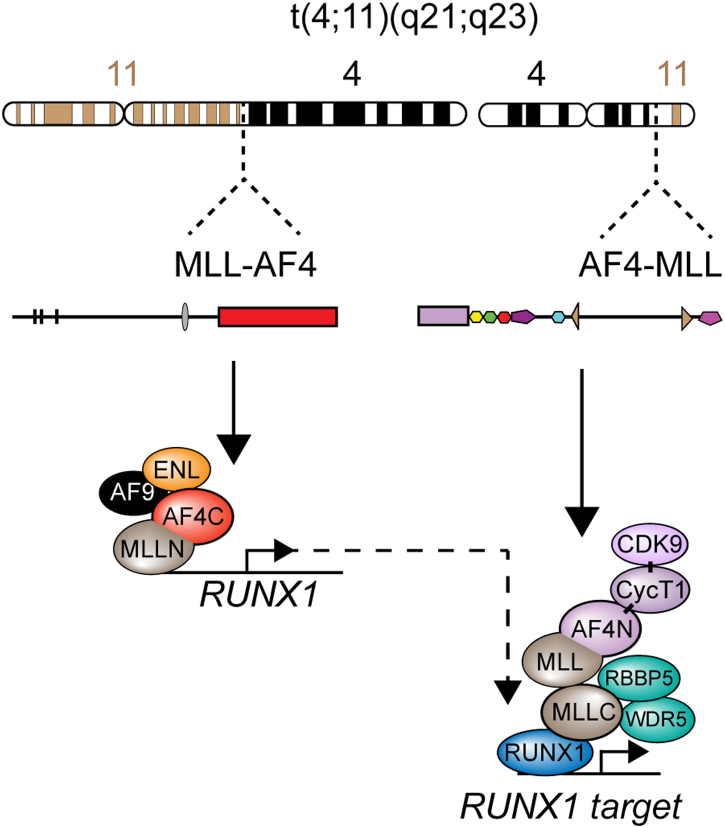
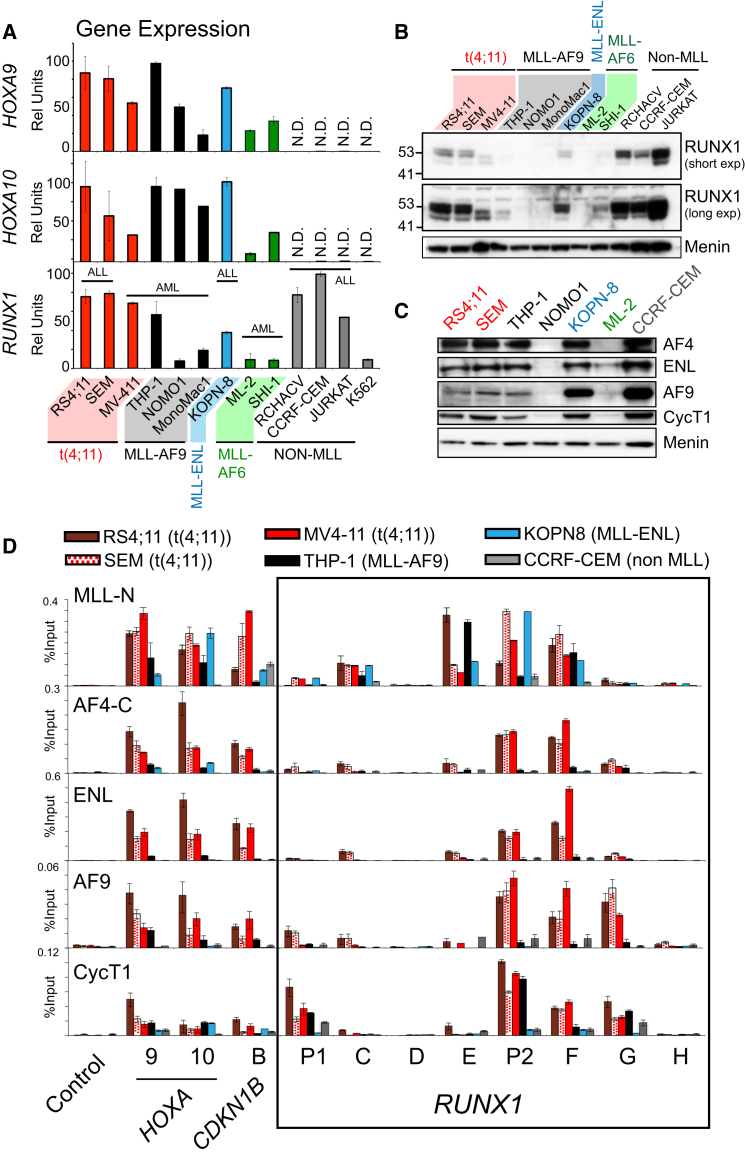
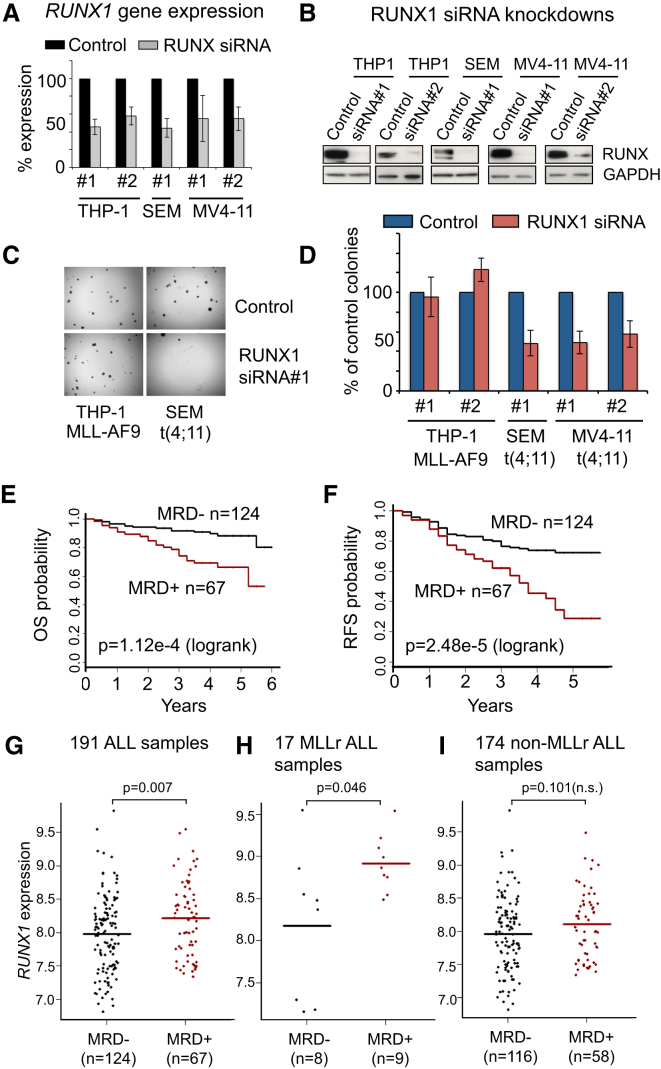
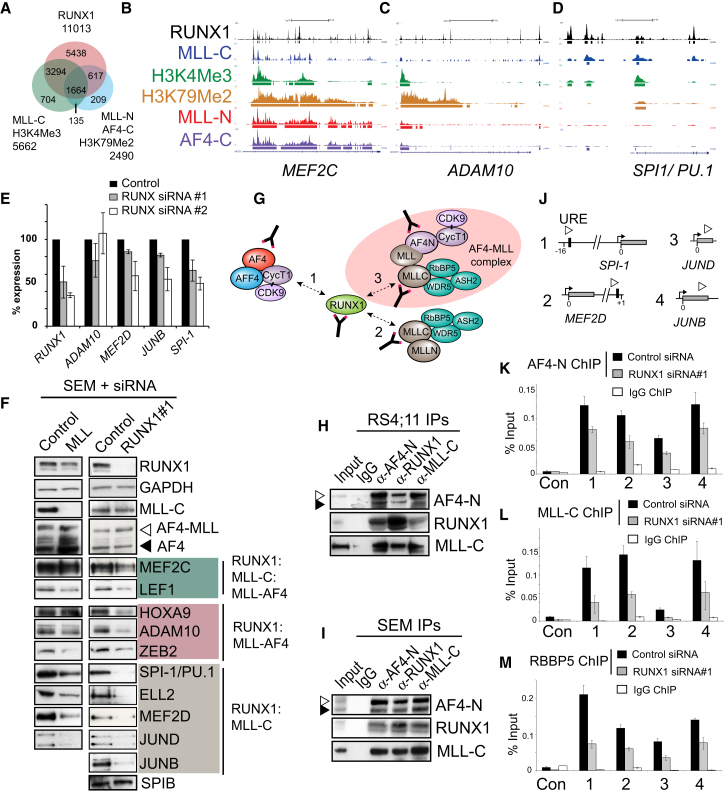
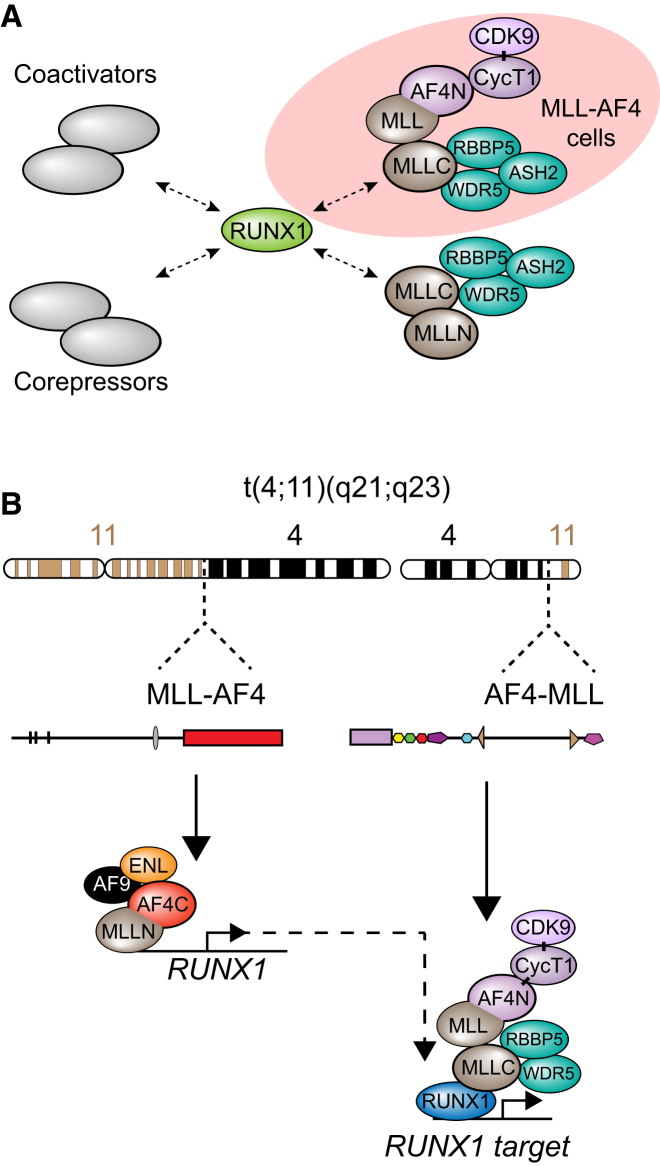
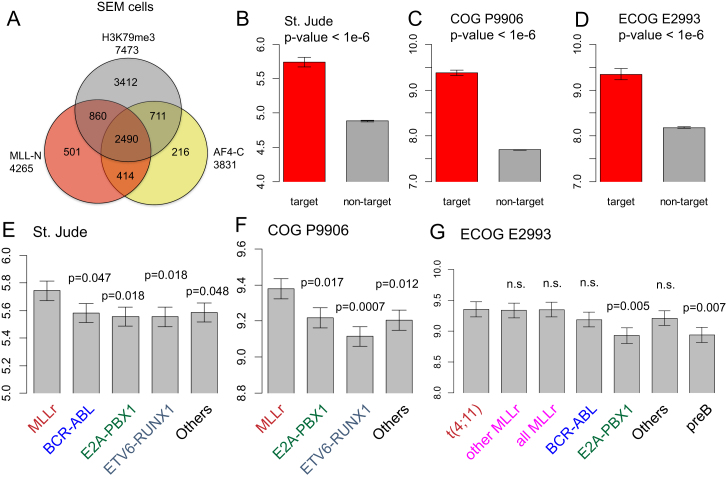
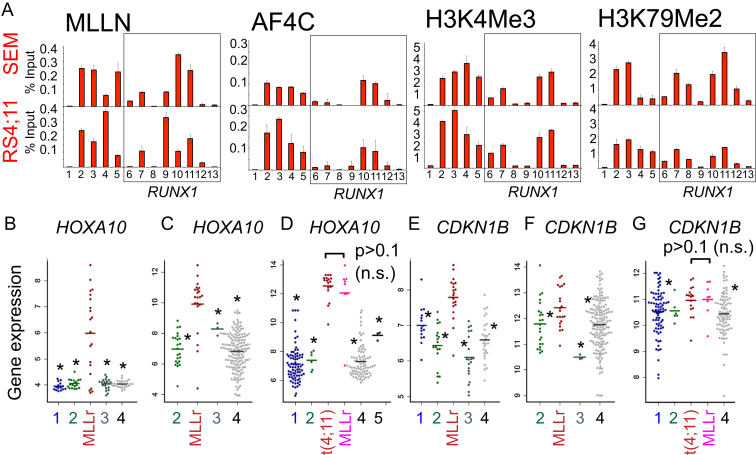
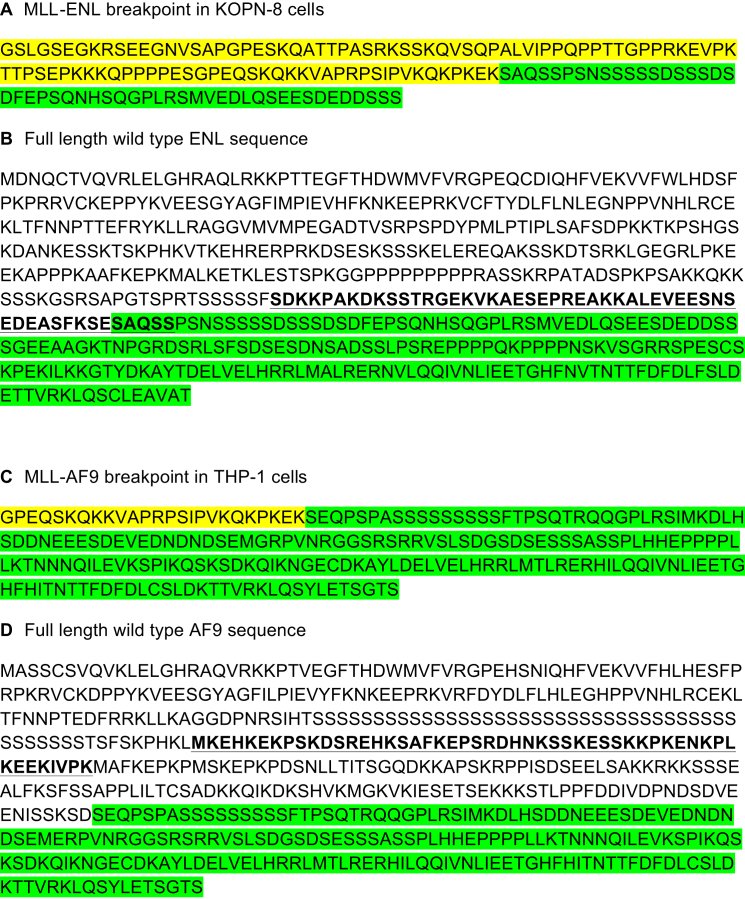
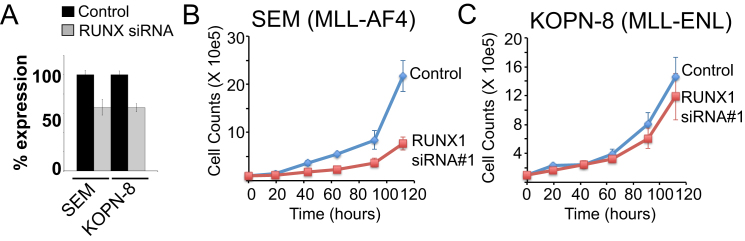
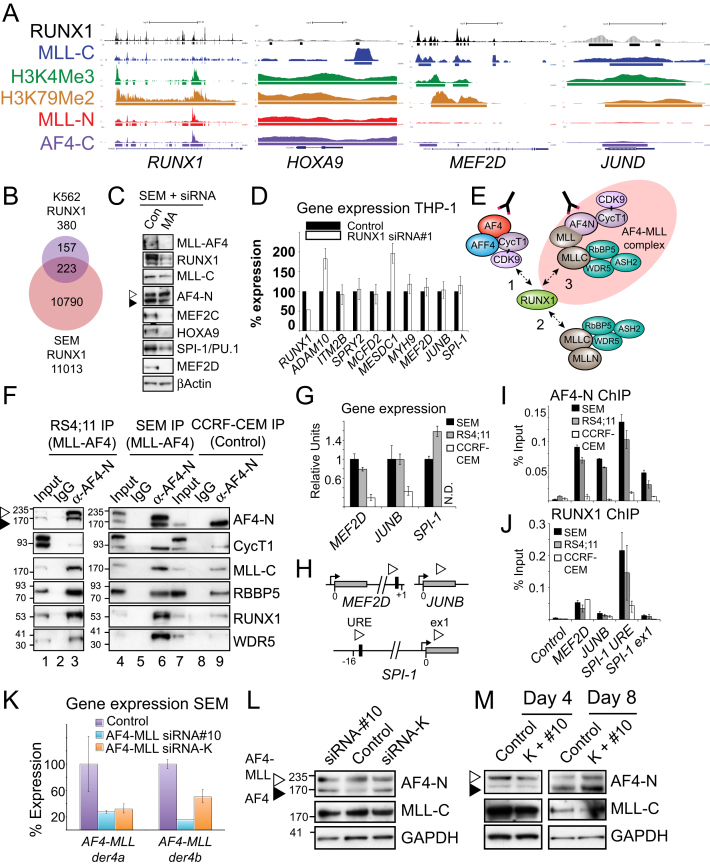
The Mixed Lineage Leukemia (MLL) protein is an important epigenetic regulator required for the maintenance of gene activation during development. MLL chromosomal translocations produce novel fusion proteins that cause aggressive leukemias in humans. Individual MLL fusion proteins have distinct leukemic phenotypes even when expressed in the same cell type, but how this distinction is delineated on a molecular level is poorly understood. Here, we highlight a unique molecular mechanism whereby the RUNX1 gene is directly activated by MLL-AF4 and the RUNX1 protein interacts with the product of the reciprocal AF4-MLL translocation. These results support a mechanism of transformation whereby two oncogenic fusion proteins cooperate by activating a target gene and then modulating the function of its downstream product.


Figures

None
Graphical abstract
Figure 1
Figure 1
MLL-AF4 ChIP-Seq Target Genes Are Upregulated in Primary B-ALLs (A) Wild-type MLL is proteolytically cleaved (dashed line) into N-terminal (MLL-N) and C-terminal (MLL-C) proteins. The t(4;11) breakpoint is marked by a black arrowhead labeled “bp.” The translocation fuses part of MLL-N in-frame with AF4-C (red box), and also produces a reciprocal AF4-MLL fusing AF4-N (violet box) with the rest of MLL. Antibody positions on the wild-type and fusion proteins are shown. A RUNX1 interaction domain at the C-terminal SET domain (Huang et al., 2011) is indicated by blue shading. (B and C) ChIP-seq in RS4;11 cells across the HOXA cluster (B) and CDKN1B (C). The number of reads for peak summits was normalized by the total number of reads per track (set to 1 Gb for each track). Four different primer sets used for real-time PCR ChIP analysis are shown (red boxes) for the following amplicons: A9, A10, CDKN1B-A, and -B. (D) ChIP-seq in RS4;11 cells using antibodies to MLL-N, AF4-C, and H3K79Me2 produced an overlap at 603 target genes. (E) Comparison between the 603 RS4;11 target gene set from (D) and similar ChIP-seq data from SEM cells (Guenther et al., 2008) produced a set of 491 common MLL-AF4 targets (see Table S1). (F–I) The average expression of the 491 MLL-AF4 fusion target genes common in RS4;11 and SEM cells have significantly higher (p < 1e-6, two-tailed Wilcoxon test) expression levels than the nontarget genes in MLLr B-ALL patients in three different B-ALL clinical trials. (F) St. Jude Children’s Research Hospital, n = 20 MLLr patients (Ross et al., 2003). (G) COG P9906 clinical trial, n = 21 MLLr patients (Harvey et al., 2010). (H) ECOG E2993 clinical trial, n = 25 MLLr patients (Geng et al., 2012). (I) The same data as in (H), split into t(4;11) versus other MLLr patient samples. Boxplots (F–H) represent the median values and error bars represent extreme maximum and minimum whisker values for each plot. Bar plots (I) are the mean and error bars represent SEM. See also Table S1 and Figure S1.
Figure 2
Figure 2
RUNX1 Is a Direct Target of MLL-AF4 and Is Specifically Upregulated in t(4;11) B-ALLs (A and B) ChIP-seq data in SEM (A) and in RS4;11 (B) cells across the RUNX1 locus using the antibodies as indicated. Reads were normalized as in Figure 1. Gray bars highlight the positions of the P1 and P2 promoters as well as the +23 enhancer. Primer sets used for real-time PCR ChIP analysis are shown (red boxes). (C–H) The average expression of either HOXA9 (C–E) or RUNX1 (F–H) in three B-ALL clinical trials separated into different ALL subtypes as indicated. (C and F) St. Jude ALL patients (Ross et al., 2003). (D and G) COG P9906 clinical trial (Harvey et al., 2010). (E and H) ECOG E2993 clinical trial (Geng et al., 2012). An asterisk indicates significantly lower average expression for the leukemia subtype relative to MLLr (C, D, F, and G) or relative to t(4;11) (E and H). A two-tailed Wilcoxon test was used to calculate p values, and p values for the different comparisons are in Table S2. See also Tables S3, S4, and Figure S2.
Figure 3
Figure 3
MLL-AF4 Directly Regulates RUNX1 and Other Target Genes by Stabilizing AF9 and ENL Binding (A) MLL, MLL-AF4, HOXA9, and RUNX1 real-time PCR expression in scrambled control siRNA-treated cells (black bars), MLL-AF4 siRNA-treated SEM (gray bars), and RS4;11 (white bars) cells. Data are the mean ± SD (error bars) of three independent knockdown experiments. In each individual experiment, control values were set to 1. (B and C) Western blots as indicated in SEM cells (B) or RS4;11 cells (C) treated with the siRNAs as indicated. Proteins were detected using the antibodies indicated except MLL-AF4, which was detected with an AF4-C antibody. (D) A summary of AF4 protein interactions. (E) MLL-N, AF4-C, AFF4, ENL, AF9, and Cyclin T1 ChIP + real-time PCR with scrambled control versus MLL-AF4 siRNA-treated SEM cells from (A). Values and error bars represent the mean ± SD of at least two independent ChIP experiments. Primer sets are as in Figure 1B, 1C, and 2A.
Figure 4
Figure 4
In t(4;11) Cells, RUNX1 Is Highly Expressed and Has High Levels of ENL and AF9 Bound to the Locus (A) Real-time PCR quantification (see gene expression analysis in Extended Experimental Procedures) of HOXA9 (top), HOXA10 (middle), and RUNX1 (bottom) gene expression in patient cell lines. The cell lines analyzed are: RS4;11 (t-4;11), SEM (t-4;11), MV4-11 (t-4;11), THP-1 (MLL-AF9), NOMO-1 (MLL-AF9), MONO-MAC1 (MLL-AF9), KOPN-8 (MLL-ENL), ML-2 (MLL-AF6 and an MLL deletion), SHI-1 (MLL-AF6), RCH-ACV (normal MLL), CCRF-CEM (normal MLL), JURKAT (normal MLL), and K562 (normal MLL). Error bars represent the ±SD of two independent experiments. ALL, acute lymphoblastic leukemia; AML, acute myeloid leukemia; N.D., not detected. (B) Western blot of RUNX1 in the cell lines as described in (A) with a short exposure (top panel) and a long exposure (middle panel). (C) Western blot of nuclear extracts in the cell lines indicated and probed with the antibodies as indicated. (D) MLL-N, AF4-C, ENL, AF9, and Cyclin T1 ChIP in RS4;11 (dark red bars), SEM (spotted red bars), MV4-11 (bright red bars), THP-1 (black bars), KOPN-8 (blue bars), and CCRF-CEM (gray bars) patient cell lines. The control primer set is from a random gene-poor region on human chromosome 8; otherwise, primer sets are as indicated in Figures 1B, 1C, and 2A. Error bars represent the ±SD of two independent experiments. See also Figure S3.
Figure 5
Figure 5
High-Level RUNX1 Expression Is Important for t(4;11) Cell Growth and Correlates with a Poor Clinical Prognosis in MLL-Rearranged Leukemias (A) Real-time PCR expression of RUNX1 in THP-1 (MLL-AF9), SEM (t-4;11), and MV4-11 (t-4;11) cells treated with either a nontargeting control siRNA or two different RUNX1 siRNAs (#1 and #2). Data for THP-1#1 and SEM#1 are the mean ± SD of six independent experiments. The rest of the data are the mean ± SD of three independent experiments. Samples for gene expression analysis were taken the day of colony assay plating. (B) Representative western blots from samples in (A) probed with either RUNX1 or GAPDH antibodies. (C) Representative photomicrographs of THP-1 (left column) and SEM (right column) clonogenic cultures after treatment with either a nontargeting control (top row) or with RUNX1 siRNA#1 (bottom row). (D) Colony counts 14 days after plating. Data are the mean ± SD of either six independent experiments (THP-1#1 and SEM#1) or three independent experiments (the rest). Three replicates were plated per experiment. Control samples were set at 100% for each individual experiment. (E and F) Kaplan-Meier estimates of overall survival (OS) and relapse-free survival (RFS) based on minimal residual disease (MRD) measured at day 29 of the end-induction among 191 COG P9906 (Harvey et al., 2010) ALL patients, log rank test p values. (G) A total of 67 MRD+ patients had higher average RUNX1 expression levels than 124 MRD− patients (p = 0.00746). (H) Among 17 MLLr patients, 9 patients that were MRD+ had significantly higher levels of RUNX1 expression than 8 MRD- patients (p = 0.0464, two-tailed Wilcoxcon test). (I) Among 174 non-MLLr B-ALL patients, 58 patients who were MRD+ had no significant increase in RUNX1 expression (p = 0.101, two-tailed Wilcoxon test). See also Figure S4.
Figure 6
Figure 6
RUNX1 Interacts with the AF4-MLL Complex and Activates Gene Targets (A) RUNX1 ChIP-seq in SEM cells compared with MLL-C:H3K4Me3 and MLL-N:AF4-C:H3K79Me2 ChIP-seq. (B–D) Sample ChIP-seq tracks from SEM cells across MEF2C (B), ADAM10 (C), and SPI1/PU.1 (D). (E) Gene expression analysis by real-time PCR in SEM cells treated with two different RUNX1 siRNAs (gray bars, siRNA#1; white bars, siRNA#2). For each experiment, the PCR signal was quantified relative to control-treated cells. Results represent the mean ± SD of three independent knockdown experiments. (F) Western blots as indicated in SEM cells treated with a nontargeting control, RUNX1 siRNA#1, or a wild-type MLL siRNA. (G) RUNX1 protein complex interactions. RUNX1 can interact with a wild-type AF4 complex (interaction 1), a wild-type MLL complex (interaction 2), and potentially with an AF4-MLL complex (interaction 3). (H and I) Immunoprecipitation (IP) experiments using RS4;11 (H) and SEM (I) nuclear extracts. Extracts were IP’d with αIgG (lane 2), αAF4-N (lane 3), αRUNX1 (lane 4) or αMLL-C (lane 5), blotted and probed with the antibodies indicated. Input lanes represent 1% of the amount of extract used for the IPs. (J) A schematic of the MEF2D, JUNB, JUND, and SPI-1 (aka PU.1) loci showing the approximate location of PCR primer sets (open arrow heads) used for ChIP analysis. Black box indicates consensus RUNX1 binding motifs in the upstream regulatory region (URE) of SPI-1 (Huang et al., 2008; Huang et al., 2011) and the first intron of MEF2D (Pencovich et al., 2011). Gray box indicates exon 1 of MEF2D, JUND, JUNB, and SPI-1. (K–M) ChIP analysis in SEM cells treated with a nontargeting control or RUNX1 siRNA#1 at the targets as indicated using antibodies to AF4-N (K), MLL-C (L), and RBBP5 (M). Error bars represent the ±SD of three separate PCR reactions. See also Table S5 and Figure S5.
Figure 7
Figure 7
MLL-AF4 Activates the RUNX1 Gene and the RUNX1 Protein Interacts with the AF4-MLL Complex and Activates Gene Targets (A) RUNX1 can interact with either coactivators or corepressors to cause gene activation or repression. In t(4;11) cells, RUNX1 can also interact with the AF4-MLL complex. (B) In t(4;11) leukemias, MLL-AF4 is expressed from one translocated chromosome, and the MLL-AF4 protein binds to and activates the RUNX1 gene by stabilizing AF9 and ENL binding. AF4-MLL is expressed from the other translocated chromosome, and the RUNX1 protein interacts with the AF4-MLL complex and binds to target genes.
Figure S1
Figure S1
MLL-AF4 Targets Genes in SEM Cells and Expression in ALL Patient Samples, Related to Figure 1 (A) MLL-AF4 target genes in SEM cells. ChIPseq analysis in SEM cells with antibodies to MLL-N, AF4-C and H3K79Me2 using data from (Guenther et al., 2008) produced an overlap of 2490 target genes (list in Table S1). (B–D) Average expression of the 491 target gene set (and the non target gene set) in MLL rearranged (MLLr) B-ALL patients from three B-ALL clinical trials expressed as bar plots with the error bars representing s.e.m. (standard error of mean). (B) St. Jude Children’s Research Hospital, n = 132 with 20 MLLr patients (Ross et al., 2003). (C) COG P9906 clinical trial, n = 207 with 21 MLLr patients (Harvey et al., 2010). (D) ECOG E2993 clinical trial, n = 191 with 25 MLLr patients (Geng et al., 2012). (E–G) Average expression 491 target gene set expressed as barplots with the error bars representing s.e.m in clinical trials from St. Jude Children’s Research Hospital, BCR-ABL patients: 15, E2A-PBX1 patients: 18, MLLr patients: 20, RUNX1-ETV6 patients: 20, Other B-ALL patients: 28 (E), COG P9906 clinical trial, E2A-PBX1 patients: 23, MLLr patients: 21, RUNX1-ETV6 patients: 3, Other B-ALL patients: 155, (F) ECOG E2993 clinical trial, BCR-ABL patients: 78, E2A-PBX1 patients: 6, MLLr patients: 25 (t(4;11): 17, other MLLr: 8, Other B-ALL patients: 82.
Figure S2
Figure S2
ChIP across RUNX1 and Additional Gene Expression in ALL Patients, Related to Figure 2 (A) MLL-N, H3K4Me3 and H3K79Me2 ChIP in SEM (upper bar plots) and RS4;11 (lower bar plots) cells at a control region (1), HOXA9 (2), HOXA10 (3), CDKN1B (4 and 5), and across RUNX1 (6-13). Primer sets are as explained in Figures 1 and 2. (B–G) HOXA10 and CDKN1B are upregulated in primary B-ALLs with MLL1 rearrangements (MLLr). The average expression of either HOXA10 (B–D) or CDKN1B (E–G) was examined in B-ALL subtypes (including several non-MLL fusion proteins) using data from patients participating in 3 large B-ALL clinical trials. (B) and (E) St. Jude Children’s Research Hospital, (Ross et al., 2003) separated into the following subtypes: BCR-ABL (blue 1), n = 15; E2A-PBX1 (green 2), n = 18; MLL rearrangements (MLLr), n = 20; ETV6-RUNX1 (teal 3), n = 20; Others (black 4), n = 28. (C) and (F) COG P9906 clinical trial, (Harvey et al., 2010) separated into the following subtypes: E2A-PBX1 (green 2), n = 23; MLLr, n = 21; ETV6/RUNX1 (teal 3), n = 3; Others (black 4), n = 155. (D) and (G) ECOG E2993 clinical trial, (Geng et al., 2012) separated into the following subtypes: BCR-ABL (blue 1), n = 78; E2A-PBX1 (green 2), n = 6; t(4;11), n = 17; Other MLLr, n = 8; Others (black 4), n = 82; normal preB cells (black 5), n = 3. An asterisk indicates significantly lower average expression for the leukemia subtype relative to MLLr (B,C,E,F) or relative to MLL-AF4 (D,G). HOXA10 and CDKN1B expression is not significantly different in MLLr versus MLL-AF4 samples (F and I, p > 0.1). Other p values for the different comparisons are in Table S2.
Figure S3
Figure S3
Antibody Epitopes Compared to MLL-FP Sequences in KOPN-8 (MLLENL) and THP-1 (MLL-AF9) Cells, Related to Figure 4 (A) Fusion sequence between MLL ex8 (yellow) and ENL ex7 (green) in KOPN-8 cells. The breakpoint was determined by sequencing cDNA from KOPN-8 cells. (B) Wild-type ENL protein sequence, sequence in KOPN-8 MLL-ENL fusion (green) and sequence recognized by Bethyl antibody A302-268A (Bold, underline). (C) Fusion sequence between MLL ex8 (yellow) and AF9 ex5 (green) in THP-1 cells, sequence taken from Odero et al. (2000). (D) Wild-type AF9 protein sequence, sequence in THP-1 MLL-AF9 fusion (green) and sequence recognized by Bethyl antibody A300-595A (Bold, underline).
Figure S4
Figure S4
RUNX1 Expression Is Important for t(4;11) But Not MLL-ENL Growth, Related to Figure 5 (A) Real Time PCR expression of RUNX1 in SEM (t-4;11) or KOPN-8 (MLL-ENL) cells treated with either a non-targeting control siRNA or a RUNX1 siRNA (#1). Error bars represent the ± SD of three separate PCR reactions. (B and C) Cell counts of the control (blue line) or RUNX1 siRNA (red line) treated cells from (A) in SEM (B) or KOPN-8 (C) cells over ∼5 days. Error bars represent the ± SD of two independent experiments.
Figure S5
Figure S5
RUNX1 ChIPseq and AF4-MLL Complex Data, Related to Figure 6 (A) Sample ChIP-seq tracks from SEM cells across RUNX1, HOXA9, MEF2D and JUND. (B) ChIP-seq overlap between the RUNX1 SEM cell target gene set versus the set of RUNX1 target genes from (Pencovich et al., 2011). (C) Western blots for the proteins indicated in SEM cells treated with a scrambled control or an MLL-AF4 siRNA. Proteins were detected using the antibodies indicated except MLL-AF4, which was detected with an AF4-C antibody. (D) Gene expression analysis of selected genes in THP-1 cells treated with RUNX1 siRNA (siRNA#1). For each experiment, the PCR signal was quantified relative to the appropriate control treated cells. Results represent the average of three independent knockdown experiments, and error bars represent the standard deviation between experiments. (E) A schematic of protein complex interactions centering on the RUNX1 protein. RUNX1 can interact with a wild-type AF4 complex (interaction 1) through CyclinT1 (Elagib et al., 2008; Jiang et al., 2005), a wild-type MLL-C complex (interaction 2) and potentially with an AF4-MLL complex (interaction 3). (F) Immunoprecipitation (IP) experiments using RS4;11 (t(4;11)), SEM (t(4;11)) and CCRF-CEM (wild-type MLL1) nuclear extracts. Extracts were IP’d with either αAF4-N (lane 3, 6 and 9) or a control αIgG (lane 2, 5 and 8) antibody, blotted and probed with the antibodies indicated. Lane 1,4 and 7 (Inputs) represents 1% of the amount of extract used for the IPs. AF4-MLL is indicated by a white arrowhead (AF4-MLL is 328 KDa, the white arrowhead represents the ∼194KDa Taspase 1 cleaved product) while wild-type AF4 is indicated by a black arrowhead (wild-type AF4 has a predicted size of 131 KDa but an apparent MW of 175 KDa). MLL-C is the Taspase 1 cleaved product of both AF4-MLL and wild-type MLL which is 134KDa but runs with an apparent MW of 180KDa. (G) Real Time PCR of MEF2D, JUNB and SPI-1 expression in SEM, RS4;11 and CCRF-CEM cells. (H) A schematic of the MEF2D, JUNB and SPI-1 (aka PU.1) loci showing the approximate location of PCR primer sets (open arrow heads) used for ChIP analysis. Black box = consensus RUNX1 binding motifs in the upstream regulatory region (URE) of SPI-1 (Huang et al., 2008; Huang et al., 2011). and the first intron of MEF2D (Pencovich et al., 2011). Grey box = exon1 of MEF2D, JUNB and SPI-1. (I and J) ChIP analysis in SEM (black bars), RS4;11 (gray bars), CCRF-CEM (white bars) at the targets as indicated using antibodies to AF4-N (I) or RUNX1 (J). (K) Real Time PCR expression of AF4-MLLder4a and der4b (Kumar et al., 2011) in SEM cells treated with a scrambled control (purple bars), an AF4-MLL siRNA (siRNA#10, blue bars) or an AF4-MLL siRNA (siRNA-K, orange bars) from (Kumar et al., 2011). Error bars represent the ± SD of three separate PCR reactions. In each individual experiment, control values were arbitrarily set to 100. AF4-MLL siRNA sequences are in supplemental methods. (L) Western blots of the AF4-MLL knockdowns in (K) using the antibodies indicated. The apparent MW of AF4-MLL and MLL-C is explained in (F) above. (M) Western blots at day 4 and day 8 of SEM cells treated with both AF4-MLL siRNA-K and siRNA#10 at day 0, day 2, day 4 and day 7. Antibodies are as indicated. AF4-MLL is indicated by a white arrowhead while wild-type AF4 is indicated by a black arrowhead as explained in (F) above.

Similar articles

Cited by

References

    1. Akalin A., Garrett-Bakelman F.E., Kormaksson M., Busuttil J., Zhang L., Khrebtukova I., Milne T.A., Huang Y., Biswas D., Hess J.L. Base-pair resolution DNA methylation sequencing reveals profoundly divergent epigenetic landscapes in acute myeloid leukemia. PLoS Genet. 2012;8:e1002781. - PMC - PubMed
    1. Bardini M., Spinelli R., Bungaro S., Mangano E., Corral L., Cifola I., Fazio G., Giordan M., Basso G., De Rossi G. DNA copy-number abnormalities do not occur in infant ALL with t(4;11)/MLL-AF4. Leukemia. 2010;24:169–176. - PubMed
    1. Bardini M., Galbiati M., Lettieri A., Bungaro S., Gorletta T.A., Biondi A., Cazzaniga G. Implementation of array based whole-genome high-resolution technologies confirms the absence of secondary copy-number alterations in MLL-AF4-positive infant ALL patients. Leukemia. 2011;25:175–178. - PubMed
    1. Benedikt A., Baltruschat S., Scholz B., Bursen A., Arrey T.N., Meyer B., Varagnolo L., Müller A.M., Karas M., Dingermann T., Marschalek R. The leukemogenic AF4-MLL fusion protein causes P-TEFb kinase activation and altered epigenetic signatures. Leukemia. 2011;25:135–144. - PubMed
    1. Bernt K.M., Zhu N., Sinha A.U., Vempati S., Faber J., Krivtsov A.V., Feng Z., Punt N., Daigle A., Bullinger L. MLL-rearranged leukemia is dependent on aberrant H3K79 methylation by DOT1L. Cancer Cell. 2011;20:66–78. - PMC - PubMed

Supplemental References

    1. Bolstad, B.M., Irizarry, R.A., Astrand, M., and Speed, T.P. (2003). A comparison of normalization methods for high density oligonucleotide array data based on variance and bias. Bioinformatics 19, 185–193. - PubMed
    1. Borowitz, M.J., Devidas, M., Hunger, S.P., Bowman, W.P., Carroll, A.J., Carroll, W.L., Linda, S., Martin, P.L., Pullen, D.J., Viswanatha, D., et al. (2008). Clinical significance of minimal residual disease in childhood acute lymphoblastic leukemia and its relationship to other prognostic factors: a Children's Oncology Group study. Blood 111, 5477–5485. - PMC - PubMed
    1. Chen, S., Xue, Y., Zhang, X., Wu, Y., Pan, J., Wang, Y., and Ceng, J. (2005). A new human acute monocytic leukemia cell line SHI-1 with t(6;11)(q27;q23), p53 gene alterations and high tumorigenicity in nude mice. Haematologica 90, 766–775. - PubMed
    1. Dignam, J.D., Lebovitz, R.M., and Roeder, R.G. (1983). Accurate transcription initiation by RNA polymerase II in a soluble extract from isolated mammalian nuclei. Nucleic Acids Res. 11, 1475–1489. - PMC - PubMed
    1. Elagib, K.E., Mihaylov, I.S., Delehanty, L.L., Bullock, G.C., Ouma, K.D., Caronia, J.F., Gonias, S.L., and Goldfarb, A.N. (2008). Cross-talk of GATA-1 and P-TEFb in megakaryocyte differentiation. Blood 112, 4884–4894. - PMC - PubMed

Publication types

MeSH terms

Substances

Associated data