. 2013 Jan 31;3(1):8-15.
doi: 10.1016/j.celrep.2012.12.015. Epub 2013 Jan 24.

Rapid transcription fosters coordinate snail expression in the Drosophila embryo

Affiliations

Rapid transcription fosters coordinate snail expression in the Drosophila embryo

Alistair Nicol Boettiger et al. Cell Rep. .

Abstract

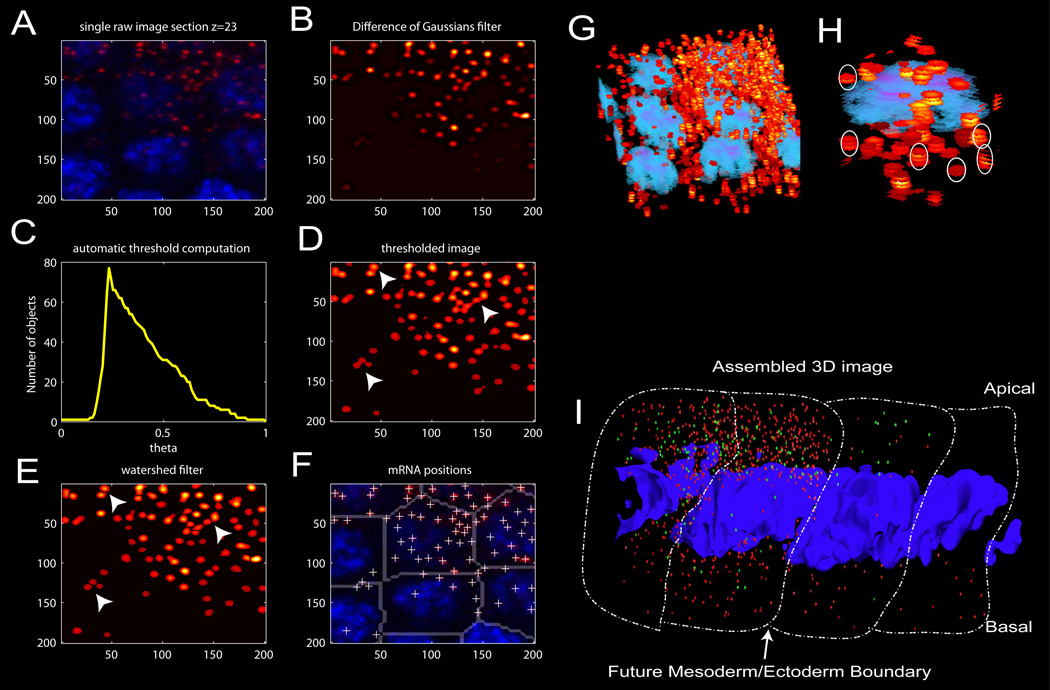
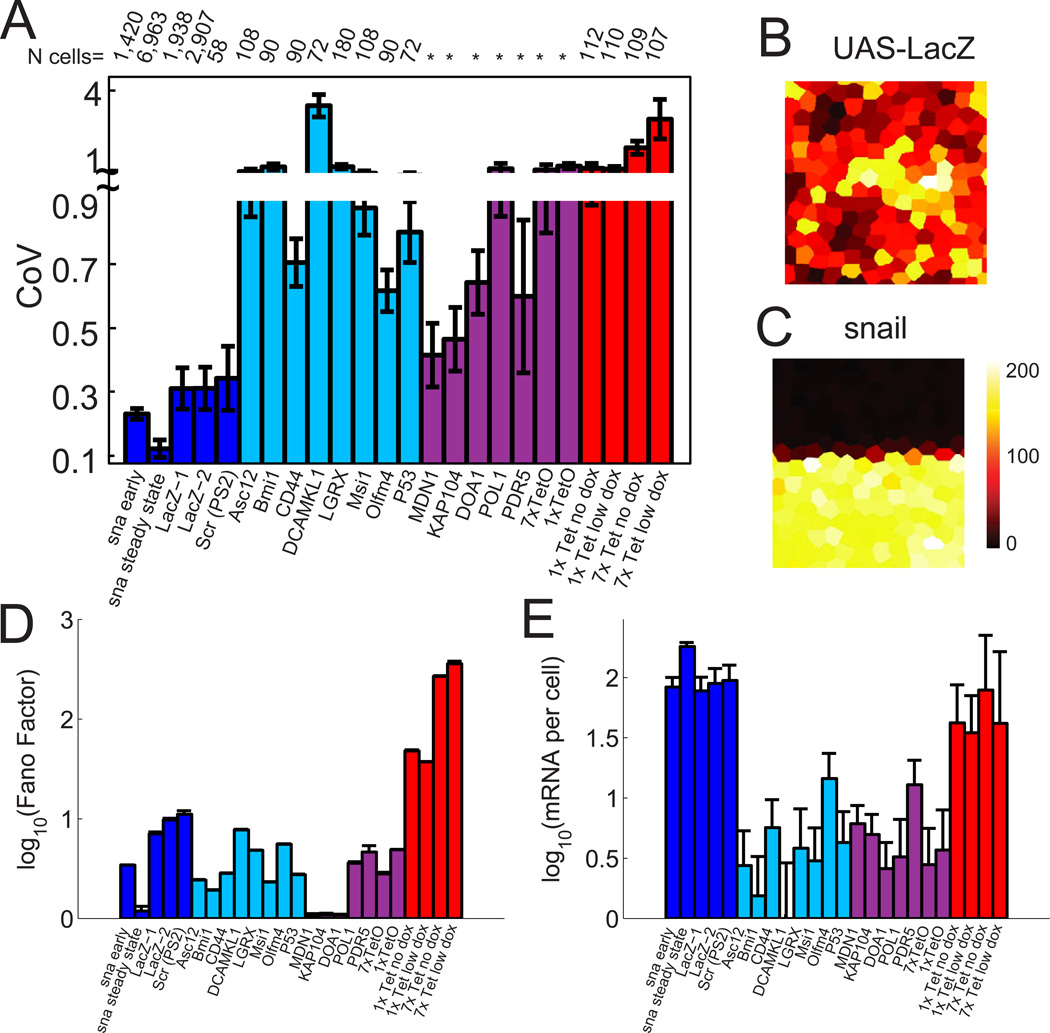
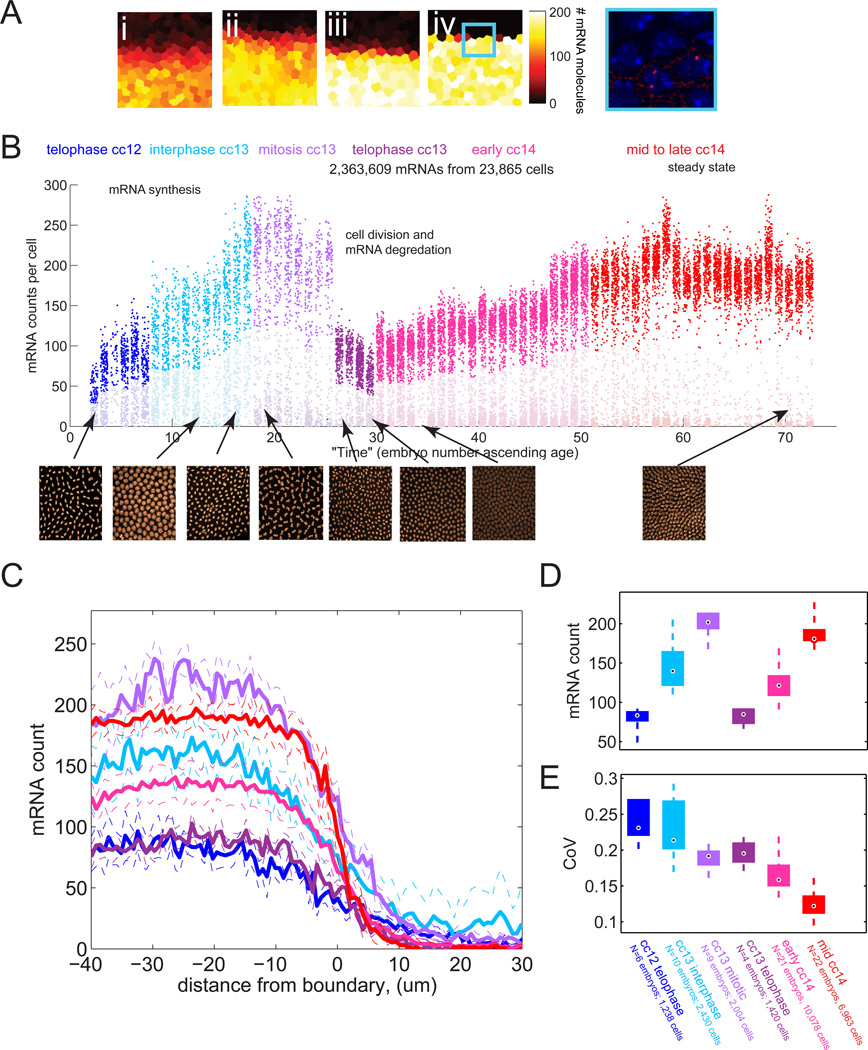
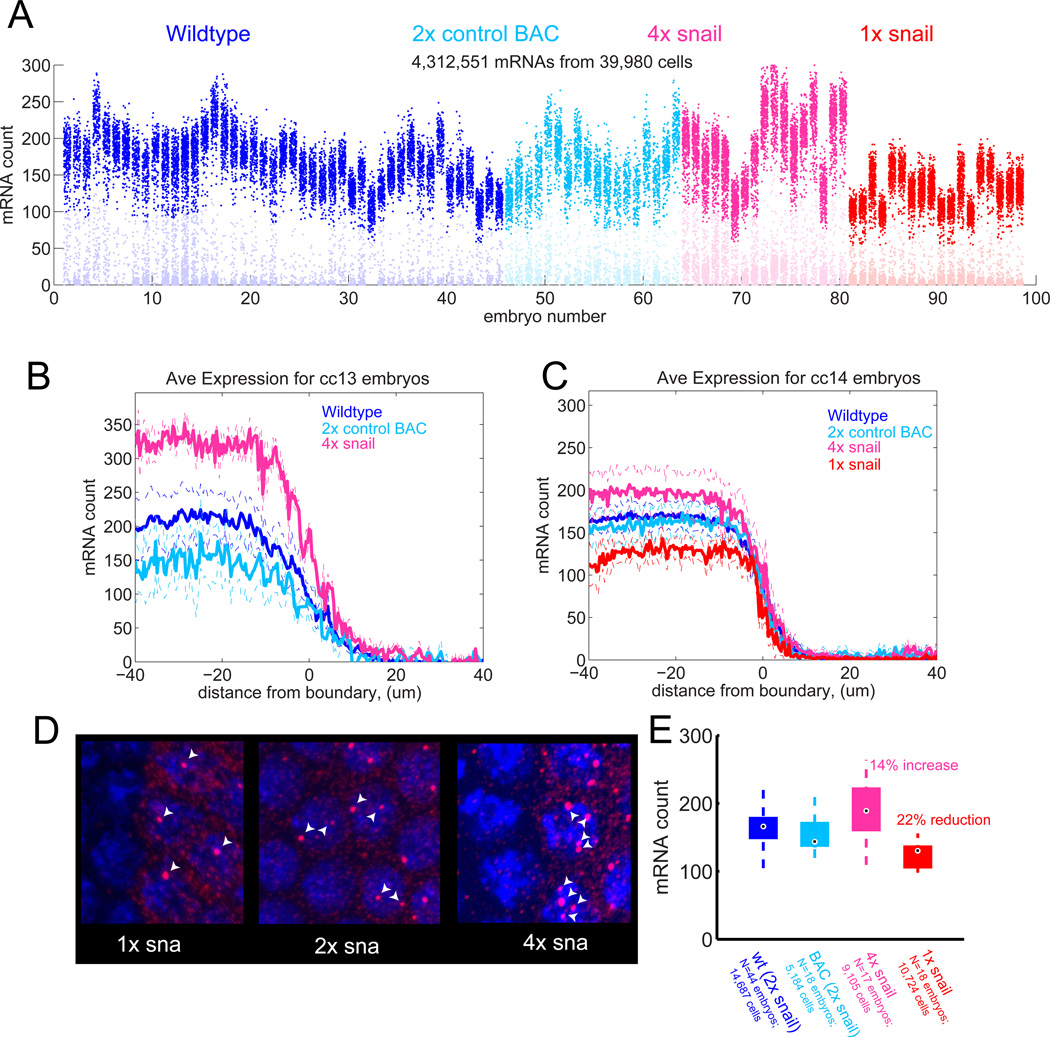
Transcription is commonly held to be a highly stochastic process, resulting in considerable heterogeneity of gene expression among the different cells in a population. Here, we employ quantitative in situ hybridization methods coupled with high-resolution imaging assays to measure the expression of snail, a developmental patterning gene necessary for coordinating the invagination of the mesoderm during gastrulation of the Drosophila embryo. Our measurements of steady-state mRNAs suggest that there is very little variation in snail expression across the different cells that make up the mesoderm and that synthesis approaches the kinetic limits of Pol II processivity. We propose that rapid transcription kinetics and negative autoregulation are responsible for the remarkable homogeneity of snail expression and the coordination of mesoderm invagination.


Figures

Figure 1
Figure 1. single molecule mRNA counting
(A) Representative individual confocal section of several adjacent nuclei, showing bright, diffraction limited spots. (B) Gaussian filtered version of the image in (A). (C) Plot of the number of separate objects identified vs. intensity threshold applied. The script selects the intensity threshold, theta, which maximizes the number of separate objects. (D) Resulting image after threshold determined in (C) is applied. Note under dense conditions, several spots remain fused (white arrows indicate examples). (E) Segmented image after a watershed algorithm is applied to unlink spots joined by the threshold in (D) (see white arrows). (F) White crosses mark the centroids of all the mRNA molecules identified in the image, which are assigned to parent nuclei using the computed nucleoid region map, indicated by gray partitions (see Methods). (G) Three dimensional-projection of 'stacked disks' (red/yellow) identified in each image plane in the previous steps. Projection of volume reconstructions of nuclei are shown in blue. (H) These disks are clustered along z to identify which dots correspond to different focus planes from the same molecule. White ovals indicate some examples. (I) Three-dimensional reassembly of individual snail mRNA transcripts (denoted by small red spheres), yellow mRNA driven from a single-copy snail BAC transgene (green spheres) and nuclei (Draq5 labeled DNA, blue). Approximate cellular boundaries have been outlined.
Figure 2
Figure 2. Homogenous expression of snail in mesodermal cells
(A) Comparison of the coefficient of variation (CoV) for genes expression in D. melanogaster (blue) M. mus. (cyan)(Itzkovitz et al., 2011), S. cerevisiae (magenta) (Zenklusen et al., 2008; To and Maheshri, 2010) and mammalian cultured CHO cells (red) (Raj et al., 2006). 'Snail early' refers to CoV measured at the onset of cycle 14 (telophase of cycle 13). 'Snail steady state' is the mid cycle 14 stable levels. lacZ-1 and lacZ-2 are from ubiquitous induction of two different UAS-lacZ lines with different maternal drivers. Scr measurements from Paré et al (Paré et al., 2009). Error-bars indicate standard deviation in CoV between embryos (for Drosophila) or by bootstrapping the population of single-cell measurements. (B) Spatial distribution of mRNA counts per cell for ubiquitously induced lacZ expression during cycle 14. The colored tiles outlines the “nucleoid region” around each nucleus. The color of the tile indicates the number of mRNA molecules counted within (see colorbar next to (C)). (C) Spatial distribution snail mRNA counts per cell during cycle 14. (D) Fano factor comparison for lacZ, snail and all previously published data shown in (A). (E) Comparison of median mRNA counts per cell over all cycle 14 embryos for snail, lacZ and previously published data.
Figure 3
Figure 3. Dynamics of mRNA expression at the single cell level
(A) Heat map representation of the number of mRNA in each cell for progressively older embryos (i)–(iv) in cycle 14. The colored tiles outlines the “nucleoid region” around each nucleus. The color of the tile indicates the number of mRNA molecules counted within (see colorbar after (iv)). A single confocal slice from the box in panel (iv) is shown at right. (B) mRNA counting results. Each column represents a single embryo, each dot a single cell, the y position indicates the number of mRNA found in that cell. Embryos are sorted approximately by age. The color of the dot indicates the age class as determined by nuclear density and nuclear morphology. Representative nuclei images for each class are shown in the insets below. (C) Average mRNA per cell for embryos in each age class as a function of cell distance from the snail boundary. Dashed lines represent +/− standard deviation. Color code as in (B). (D) Distribution of average mRNA counts per mesodermal cell, for embryos in each age class. The mesodermal boundary is defined as the area where the mRNA count, averaged across a line perpendicular to the the boundary, drops below half its maximal value. The box spans from the lower to upper quartile. The median is indicated by the black dot. Whiskers extend to greatest and smallest data point. (E) Box plots of coefficient of variation for embryos in each age class.
Figure 4
Figure 4. Dosage compensation by weak negative feedback
(A) Counting results from 98 cycle 14 embryos with wildtype snail locus (blue), 2 copies of a snail BAC in a snail deletion background (cyan), this BAC in a wildtype background providing 4 copies of snail (pink), single copy of snail (red). (B) Average spatial profiles of mRNA expression from embryos at mitosis of cycle 13: endogenous snail (blue), BAC transgene (cyan) or both (pink). 1X snail embryos can not be identified at mitotic stages due to the absence of nascent transcripts, see (D). (C) As in (B) but for cycle 14. (D) Identification of 1× snail embryos by counting nascent transcripts. Note the median number of detectable nascent transcripts per cell provides a reliable indication of the copy number for snail. (E) Box-and-whisker plot summarizing effect of copy number on mRNA levels. Whiskers mark the positions of the highest and lowest count in sample. Boxes indicate inter-quartile range and median.

References

    1. Ardehali MB, Lis JT. Tracking rates of transcription and splicing in vivo. Nature structural & molecular biology. 2009;16:1123–1124. - PubMed
    1. Boettiger AN, Levine M. Synchronous and stochastic patterns of gene activation in the Drosophila embryo. Science. 2009;325:471–473. - PMC - PubMed
    1. Boettiger AN, Ralph PL, Evans SN. Transcriptional regulation: effects of promoter proximal pausing on speed, synchrony and reliability. PLoS computational biology. 2011;7:e1001136. - PMC - PubMed
    1. Darzacq X, Shav-Tal Y, De Turris V, Brody Y, Shenoy SM, Phair RD, Singer RH. In vivo dynamics of RNA polymerase II transcription. Nature structural & molecular biology. 2007;14:796–806. - PMC - PubMed
    1. Davis I, Ish-Horowicz D. Apical localization of pair-rule transcripts requires 3’ sequences and limits protein diffusion in the Drosophila blastoderm embryo. Cell. 1991;67:927–940. - PubMed

Publication types

MeSH terms

LinkOut - more resources