

Classification of amyloid-positivity in controls: comparison of visual read and quantitative approaches
- PMID: 23353602
- PMCID: PMC3605888
- DOI: 10.1016/j.neuroimage.2013.01.015
Classification of amyloid-positivity in controls: comparison of visual read and quantitative approaches
Abstract
An important research application of amyloid imaging with positron emission tomography (PET) is detection of the earliest evidence of fibrillar amyloid-beta (Aβ) deposition. Use of amyloid PET for this purpose, requires a reproducible method for defining a cutoff that separates individuals with no significant Aβ deposition from those in which Aβ deposition has begun. We previously reported the iterative outlier approach (IO) for the analysis of Pittsburgh Compound-B (PiB) PET data. Developments in amyloid imaging since the initial report of IO have led us to re-examine the generalizability of this method. IO was developed using full-dynamic atrophy-corrected PiB PET data obtained from a group of control subjects with a fairly distinct separation between PiB-positive [PiB(+)] and PiB-negative [PiB(-)] subjects.
Methods: We tested the performance of IO using late-summed tissue ratio data with atrophy correction or with an automated template method without atrophy correction and tested the robustness of the method when applied to a cohort of older subjects in which separation between PiB(+) and PiB(-) subjects was not so distinct.
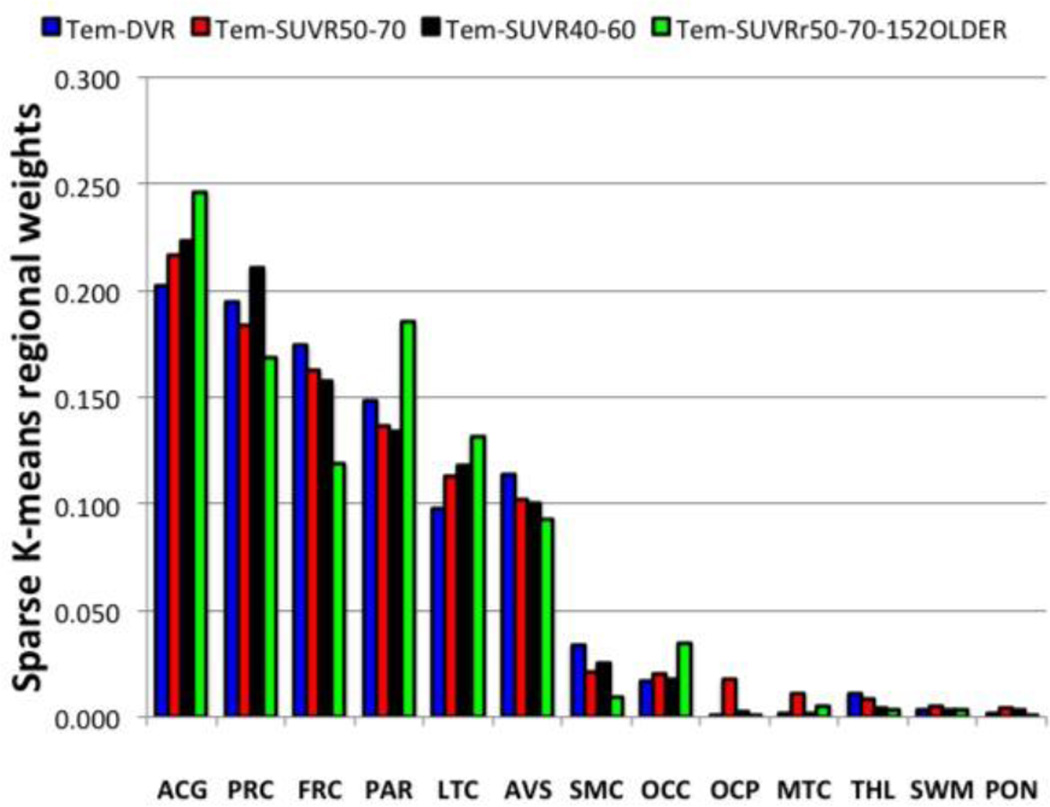
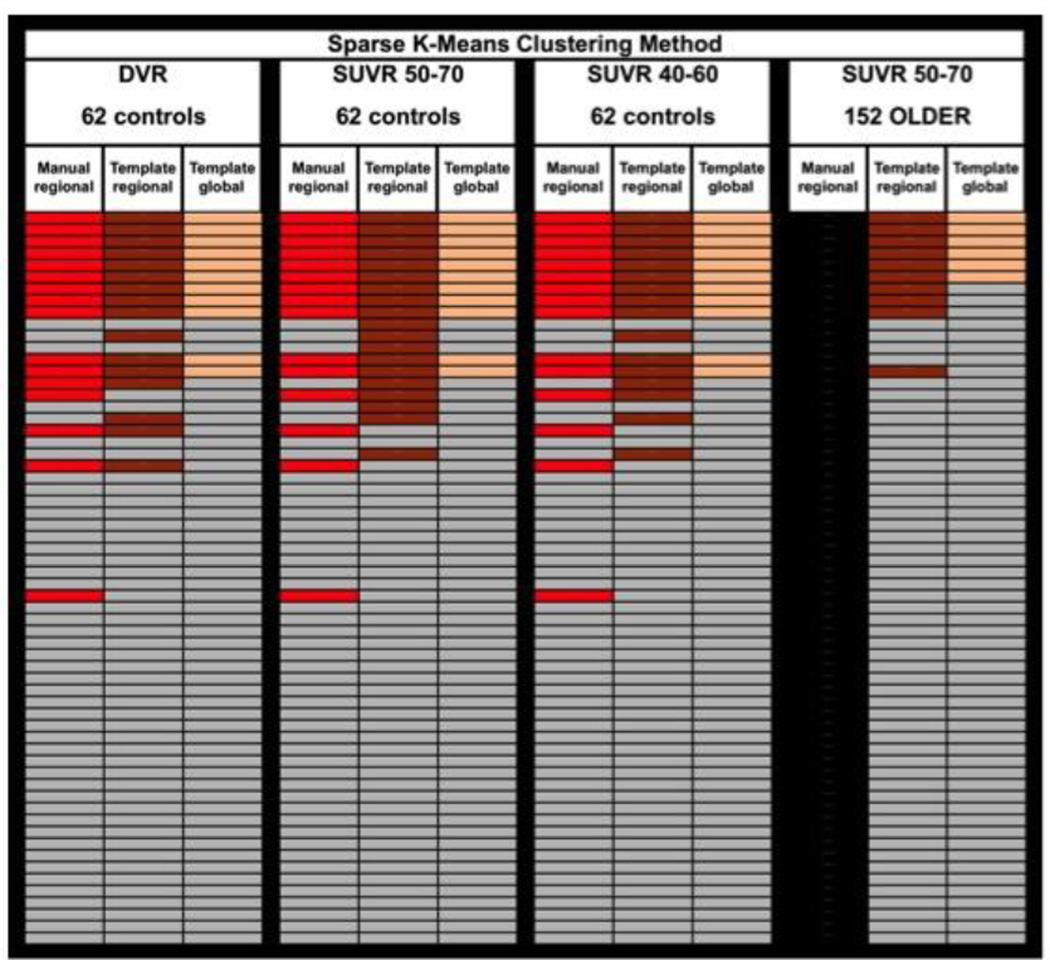
Results: The IO method did not perform consistently across analyses and performed particularly poorly when separation was less clear. We found that a sparse k-means (SKM) cluster analysis approach performed significantly better; performing more consistently across methods and subject cohorts. We also compared SKM to a consensus visual read approach and found very good correspondence.
Conclusion: The visual read and SKM methods, applied together, may optimize the identification of early Aβ deposition. These methods have the potential to provide a standard approach to the detection of PiB-positivity that is generalizable across centers.
Copyright © 2013 Elsevier Inc. All rights reserved.
Conflict of interest statement
All other authors have no conflicts of interest with this work.
Figures


References
-
- Aizenstein HJ, Nebes RD, Saxton JA, Price JC, Mathis CA, Tsopelas ND, Ziolko SK, James JA, Snitz BE, Houck PR, Bi W, Cohen AD, Lopresti BJ, DeKosky ST, Halligan EM, Klunk WE. Frequent amyloid deposition without significant cognitive impairment among the elderly. Arch Neurol. 2008;65(11):1509–1517. - PMC - PubMed
-
- Apostolova LG, Hwang KS, Andrawis JP, Green AE, Babakchanian S, Morra JH, Cummings JL, Toga AW, Trojanowski JQ, Shaw LM, Jack CR, Jr, Petersen RC, Aisen PS, Jagust WJ, Koeppe RA, Mathis CA, Weiner MW, Thompson PM. 3D PIB and CSF biomarker associations with hippocampal atrophy in ADNI subjects. Neurobiol Aging. 2010;31(8):1284–1303. - PMC - PubMed
-
- Bourgeat P, Chetelat G, Villemagne VL, Fripp J, Raniga P, Pike K, Acosta O, Szoeke C, Ourselin S, Ames D, Ellis KA, Martins RN, Masters CL, Rowe CC, Salvado O. Beta-amyloid burden in the temporal neocortex is related to hippocampal atrophy in elderly subjects without dementia. Neurology. 2010;74(2):121–127. - PubMed
-
- Cicchetti DV, Feinstein AR. High agreement but low kappa: II. Resolving the paradoxes. Journal of clinical epidemiology. 1990;43(6):551–558. - PubMed
Publication types
MeSH terms
Substances
Grants and funding
LinkOut - more resources
Full Text Sources
Other Literature Sources
Medical
