. 2013 Mar;16(3):300-8.
doi: 10.1038/nn.3321. Epub 2013 Jan 27.

Insulin induces long-term depression of ventral tegmental area dopamine neurons via endocannabinoids

Affiliations

Insulin induces long-term depression of ventral tegmental area dopamine neurons via endocannabinoids

Gwenaël Labouèbe et al. Nat Neurosci. 2013 Mar.

Abstract

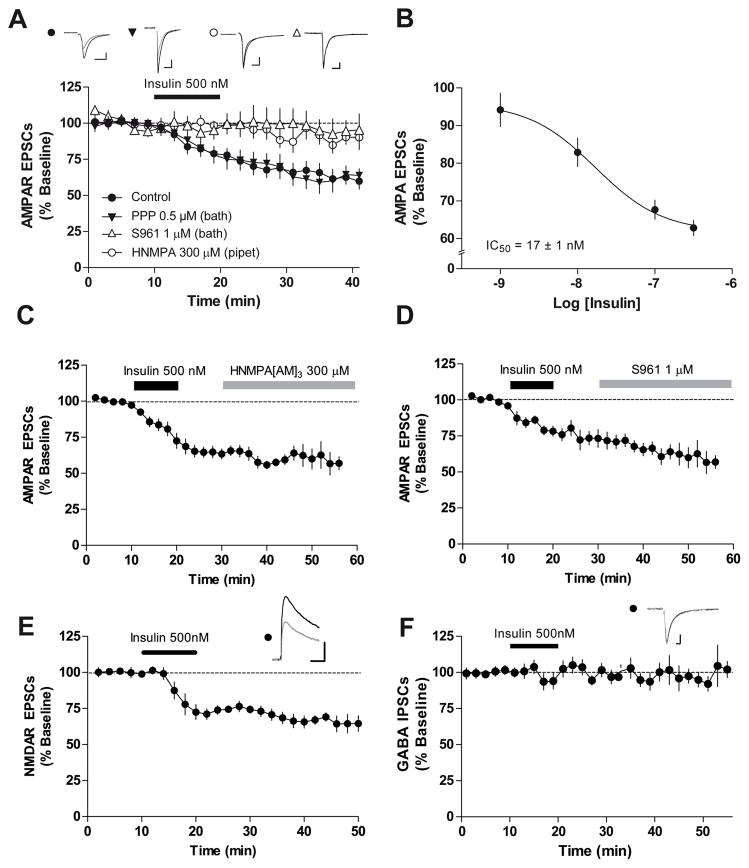
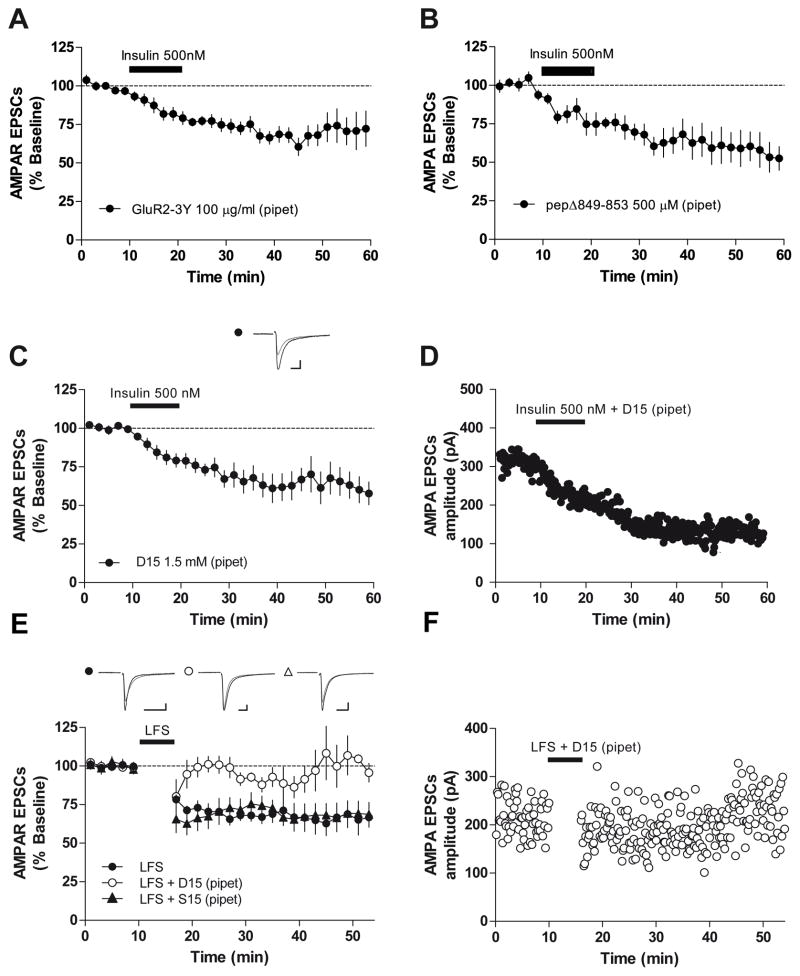
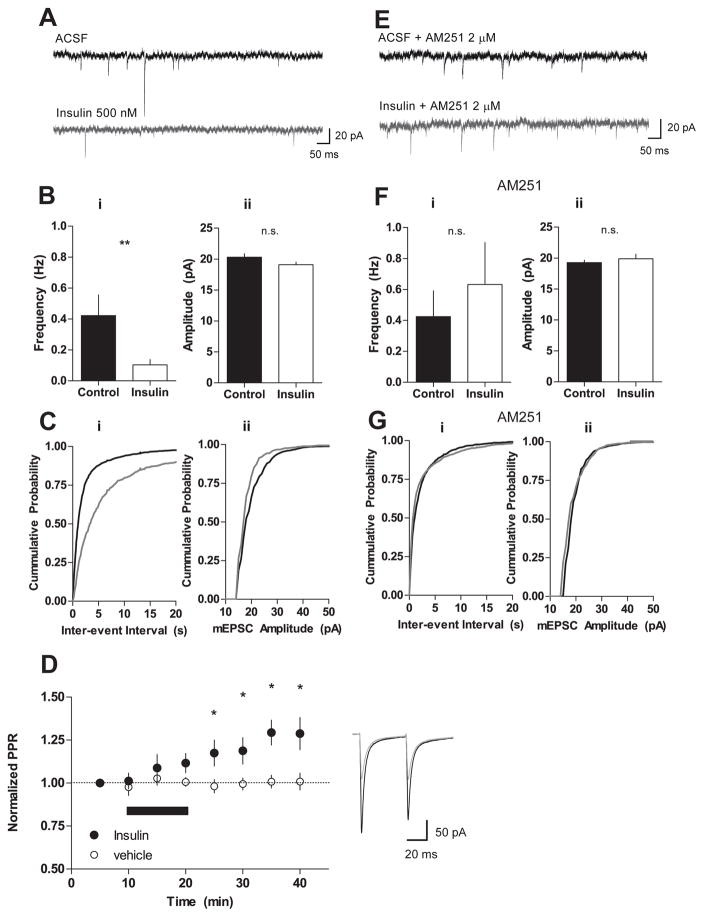
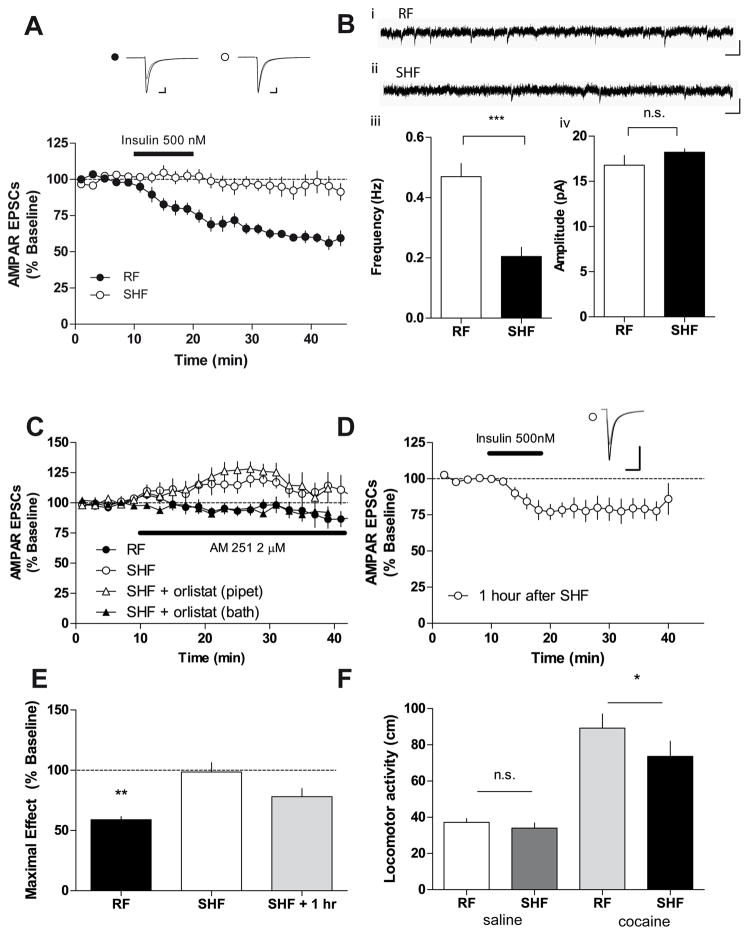
The prevalence of obesity has markedly increased over the past few decades. Exploration of how hunger and satiety signals influence the reward system can help us understand non-homeostatic feeding. Insulin may act in the ventral tegmental area (VTA), a critical site for reward-seeking behavior, to suppress feeding. However, the neural mechanisms underlying insulin effects in the VTA remain unknown. We demonstrate that insulin, a circulating catabolic peptide that inhibits feeding, can induce long-term depression (LTD) of mouse excitatory synapses onto VTA dopamine neurons. This effect requires endocannabinoid-mediated presynaptic inhibition of glutamate release. Furthermore, after a sweetened high-fat meal, which elevates endogenous insulin, insulin-induced LTD is occluded. Finally, insulin in the VTA reduces food anticipatory behavior in mice and conditioned place preference for food in rats. Taken together, these results suggest that insulin in the VTA suppresses excitatory synaptic transmission and reduces anticipatory activity and preference for food-related cues.


Figures

Figure 1
Figure 1. Insulin depresses AMPAR-mediated synaptic transmission onto VTA dopamine neurons
Evoked AMPAR EPSCs were recorded before during and after bath application of insulin (10 min). (A) Insulin depressed AMPAR EPSC amplitude in VTA dopamine neurons (filled circles, n = 9). Intracellular application of HNMPA (300 μM), an insulin receptor tyrosine kinase inhibitor (open circles, n = 7), or bath application of an insulin receptor antagonist (peptide S961) throughout the experiment (open triangles, n = 7, 1 μM) blocked insulin-induced depression of AMPAR synaptic transmission. The selective IGFR inhibitor picropodophyllotoxin (PPP; 0.5 μM), applied before during and after insulin application (500 nM, 10 min), blocked insulin-induced depression of AMPAR EPSCs (filled triangles, n = 8). Example recordings of AMPAR EPSCs at 5 (black) and 40 (grey) min are shown above of the time course. Scale bars, 10 ms and 50 pA. (B) A concentration-response curve of maximal insulin effect taken at 40 min for each concentration is fit with a sigmoidal curve. Insulin depressed AMPAR excitatory transmission onto VTA dopaminergic neurons in a dose-dependent manner (1, 10, 100 or 500 nM with n = 5, 6, 5 or 7, respectively). (C) Bath application of cell permeable HNMPA[AM]3 (300 μM) did not reverse insulin-induced LTD (n = 6). (D) Insulin receptor antagonist (S961, 1 μM) did not reverse insulin-induced LTD (n = 6). (E) Evoked NMDAR EPSCs were recorded before during and after bath application of insulin (10 min). Bath application of insulin (500 nM, 10 min) depressed NMDAR EPSC amplitude in VTA dopamine neurons (filled circles, n = 9). Example recording of NMDAR EPSCs at 5 (black) and 40 (grey) min is shown above of the time course. Scale bars, 10 ms and 50 pA. (F) Bath application of insulin (500 nM, 10 min) did not depress GABAA IPSCs amplitude in VTA dopamine neurons (filled circles, n = 7). Traces of GABAA IPSCs overlaid at 5 (black) and 40 (grey) min are shown on top of the time course. Scale bars, 5 ms and 50 pA. Stimulus artifacts have been removed for clarity. Error bars represent s.e.m.
Figure 2
Figure 2. Insulin-induced LTD requires Akt and mTOR signaling
(A) Bath application of rapamycin (50 nM, open triangles, n = 7), an inhibitor of mTOR signaling, or intracellular application of 10-DEBC (20 μM), a selective inhibitor of Akt (open circles, n = 7), blocked insulin-induced LTD. Intracellular application of PKI (20 μM, filled circles, n = 7), a protein kinase A inhibitor, did not alter insulin-induced LTD. Example recordings of overlaid AMPAR EPSCs at 5 (black) and 40 (grey) min in the presence of rapamycin (open triangle), 10-DEBC (open circle) or PKI (filled circle) are shown on top of the time course. Scale bars, 5 ms and 50 pA. (B) A bar graph showing the averaged AMPAR EPSCs 20 min after insulin application for control (Insulin alone, open bars); in the presence of PKI (patterned bar), 10-DEBC (shaded bar) or rapamycin (filled bar). Using one-way ANOVA with a Dunnet’s post hoc test comparing treatments to control, we found that 10-DEBC or Rapamycin treatments were significantly different from insulin treatment (** p<0.01, * p<0.05). Stimulus artifacts have been removed for clarity. Error bars represent s.e.m.
Figure 3
Figure 3. Insulin-induced LTD in the VTA does not require endocytosis of AMPARs
(A) Intracellular application of GluR2-3Y (100 μg/ml), an AMPAR endocytosis inhibitor that blocks the interaction AP2 with the GluA2 subunit, did not alter insulin-induced LTD of AMPARs (n = 8). (B) Intracellular application of pepΔ849-853 (500 μM) did not alter insulin-induced LTD (n = 4). (C) Intracellular application of D15 (1.5 mM), an endocytosis inhibitor that blocks the interaction of dynamin with amphiphysin, did not alter insulin-induced LTD of AMPARs (n = 7). (D) Example time course of AMPAR EPSCs amplitude in a single dopamine neuron in the presence of D15. (E) A low-frequency stimulation protocol (LFS, −40 mV, 6 min, 1 Hz stimulation) induced LTD in VTA dopamine neurons (filled circles, n = 8). Intracellular application of D15 blocked LFS-LTD (open circles, n = 6). S15 (1.5 mM), a scrambled version of the D15 peptide, did not affect LFS-LTD when applied intracellularly (filled triangles, n = 8). (F) Example time course of AMPAR EPSCs amplitude recorded before and after LFS in the presence of D15. Traces of AMPAR EPSCs overlaid at 5 (black) and 40 (grey) min are shown on top of the time course. Scale bars, 5 ms and 50 pA. Stimulus artifacts have been removed for clarity. Error bars represent s.e.m.
Figure 4
Figure 4. Insulin-induced LTD occurs presynaptically and requires CB1R activation
(A) Example recordings of AMPAR miniature EPSCs (mEPSCs) of VTA dopamine neurons 20 to 30 min after 10 min preincubation with ACSF (left) or ACSF + insulin (500 nM, right). Scale bars, 50 ms and 20 pA. (Bi) Frequency of mEPSCs events was significantly decreased after insulin treatment (open bars, n = 11) compared to control (filled bars, n = 11, p < 0.01). (Bii) AMPAR mEPSCs amplitude was not significantly different after insulin treatment (open bars, n = 11) compared to slices treated with ACSF (filled bars, n = 10, p > 0.05). (C) Cumulative probability plots for inter-event interval (i) or mEPSCs amplitude (ii) measured from VTA slices 20 to 30 min after 10 min preincubation with ACSF (black line) or ACSF + insulin (500 nM, grey line) in example VTA neurons. (D) A time course demonstrating that a paired-pulse protocol using a 50-ms inter-stimulus interval showed facilitation after application of insulin (500 nM; filled circles; n = 6). The paired pulse ratio (PPR) was not significantly different with application of vehicle (open circles; n = 4). Right panel, An example trace of a neuron recorded before (black) and 20 min (grey) after a 10-min insulin application. Stimulus artifact has been removed for clarity. (E) Example recordings of AMPAR mEPSCs of VTA dopamine neurons 20 to 30 min after 10 min preincubation with ACSF (left) or ACSF + insulin (500 nM, right) in the presence of AM251 (2 μM). (Fi) In the presence of AM251, mEPSCs frequency after insulin treatment (open bars, n = 12) was not significantly different from controls (filled bars, n = 11, p > 0.05). (Fii) In slices preincubated with AM251, AMPAR mEPSCs amplitude was not significantly different after insulin treatment (open bars, n = 12) compared to control (filled bars, n = 11, p > 0.05). (G) Cumulative probability plots for inter-event interval (i) or mEPSCs amplitude (ii) measured from VTA slices 20 to 30 min after 10 min preincubation with ACSF (black line) or ACSF + insulin (500 nM, grey line) in presence of AM251 in example VTA neurons. A significant right-shift in the cumulative probability of mEPSC frequency was detected in insulin-treated slices as compared to control slices (P<0.001, Kolmogorov-Smirnov test). Bars represent mean ± s.e.m.
Figure 5
Figure 5. Insulin-induced LTD is mediated by endocannabinoid retrograde signaling
(A) Bath application of AM251 (2 μM) prior to insulin blocked insulin-induced LTD (open circles, n = 9) compared to insulin-induced LTD in the absence of AM251 (control, filled circles, n = 7). Inset, example traces of AMPAR EPSCs at 5 (black) and 40 (grey) min in the presence (open circle) or absence (filled circle) of AM251. Scale bars, 5 ms and 50 pA. (B) In slices preincubated with WIN (1 μM), insulin did not suppress AMPAR EPSCs (n = 7). Inset, example traces of AMPAR EPSCs at 5 and 40 min. Scale bars, 5 ms and 50 pA. (C) WIN (1 μM) was bath applied 25 min after a 10 min application of insulin (500 nM). WIN did not further alter insulin-induced LTD (n = 7). Inset, example traces of AMPAR EPSCs at 5 (black), 40 (grey) and 55 (hatched) min. Scale bars, 5 ms and 50 pA. (D) Intracellular application of orlistat (2 μM) abolished insulin-induced LTD (n = 6). Inset, example traces of AMPAR EPSCs at 5 (black) and 40 (grey) min. Scale bars, 5 ms and 50 pA. (E) Bath application of AM251 (2 μM; open circles; n = 7) or orlistat (10 μM; filled circles; n = 6) did not further alter insulin-induced LTD. Insets, example traces of AMPAR EPSCs at 5 (black), 30 (dark grey) and 50 (light grey) min. Scale bars, 10 ms and 50 pA. (F) Bath application of insulin (500 nM) inhibited AMPAR EPSCs in the presence of intracellular BAPTA (10 mM; open circles) (n=9). Preincubation with AM251 (2 μM; filled circles) blocked insulin-induced LTD in the presence of intracellular BAPTA (10 mM) (n=9). Inset, example traces of AMPAR EPSCs at 5 (black) and 35 (grey) min in the presence of intracellular BAPTA (open circle) or BAPTA with AM251 (filled circle). Scale bars, 10 ms and 100 pA. Stimulus artifacts have been removed for clarity. Error bars represent s.e.m
Figure 6
Figure 6. A sweetened high fat meal increases endocannabinoid tone and occludes insulin-induced LTD onto VTA dopamine neurons
(A) Bath application of insulin (500 nM, 10 min) did not depress AMPAR EPSCs amplitude in VTA dopamine neurons from animals fed with sweetened high-fat (SHF) food (1h access before sacrifice) in comparison with control animals fed with regular food (RF) chow (open circles, n = 11 and filled circles, n = 9, respectively). Example recording of AMPAR EPSCs at 5 (black) and 40 (grey) min is shown above of the time course. Scale bars, 5 ms and 50 pA. (B) (i) Example recordings of AMPAR mEPSCs of VTA dopamine neurons from non-food restricted mice given one hour access to RF (ii) or one hour access to SHF. Scale bars, 50 ms and 20 pA. (iii) Frequency of mEPSCs events was significantly decreased in mice fed SHF (filled bars, n = 11) compared to RF (open bars, n = 6, p < 0.01). (iv) AMPAR mEPSCs amplitude was not significantly different in mice fed RF (open bars, n = 11) compared to mice fed SHF (filled bars, n = 6, p > 0.05). (C) Bath application of AM251 (2 μM) increased AMPAR EPSCs amplitude in VTA dopamine neurons from SHF-fed mice (open circles, n = 6), but not RF-fed mice (filled circles, n = 9). Intracellular orlistat (2 μM) did not alter AM251-induced increase in AMPAR EPSCs in SHF-fed mice (open triangles, n = 9). Bath application of orlistat (10 μM) inhibited the AM251-mediated increase in AMPAR EPSCs (filled triangles, n = 8). (D) Insulin-induced LTD was partially restored in VTA slices cut 1 hour after a SHF meal (n = 6). Inset, example traces of AMPAR EPSCs at 5 (black) and 40 (grey) min. Scale bars, 10 ms and 100 pA (E) Maximal effect of insulin-induced LTD in VTA slices cut immediately after mice were fed RF (open bars, n = 11) or SHF (filled bars, n = 9) or slices cut 1 hour after mice were fed SHF (grey bars; n = 6). (F) Cocaine-induced locomotor activity was significantly decreased in mice given 1 hour access to SHF (filled bar) compared to RF (light shaded) (n = 9, p < 0.05). Basal locomotor activity was not significantly different between SHF (open bar) and RF (dark shaded bar) groups (n = 6, p > 0.05). Stimulus artifacts have been removed for clarity. Bars represent means ± s.e.m.
Figure 7
Figure 7. Insulin in the VTA decreases food anticipatory activity and conditioned place preference, but not effort
(A) Mice were entrained to eat their daily caloric needs 4 hours per day. On test days mice were microinjected with insulin (5 mU) or vehicle into the VTA 10 min prior to placing them in the entrainment cage with a plexiglass barrier separating the mice from the food. Insulin-treated mice (n = 7; filled bars) had significantly less food anticipatory activity measured by (i) cage cross overs, (ii) time spent rearing, and (iii) time spend digging than vehicle-treated mice (n = 7; open bars; p < 0.05). In contrast, (iv) grooming was not significantly different between insulin-treated and saline-treated mice (n = 7, p > 0.05). (B) Non-food restricted mice were trained to lever press for food under a progressive ratio schedule. Breakpoint was defined as the total number of lever presses required to receive the final reinforcer. (i) Breakpoint for 2.5% sucrose solution was not significantly different between mice receiving intra-VTA insulin (0.065 mU (2 μM)) or vehicle (n = 9; p > 0.05). (ii) Breakpoint for sweetened condensed milk was not significantly different between mice receiving intra-VTA insulin (3.25 mU (100 μM)) or vehicle (n = 6; p > 0.05). (iii) Cumulative presses for 2.5% sucrose were not significantly different between mice receiving intra-VTA insulin (grey line) or vehicle (black line) (p > 0.05, Kolmogorov-Smirnov test). (iv) Cumulative presses for SCM were not significantly different between mice receiving intra-VTA insulin (grey line) or vehicle (black line) (p > 0.05, Kolmogorov-Smirnov test). (C) Non-food restricted rats were trained to associate one compartment with a palatable food (Froot Loops) in a CPP apparatus. Pre-test day training did not reveal a significant difference in preference score between groups (p > 0.05). (D) On the test day, rats were microinjected with insulin (0.005 mU (62 nM), 0.065 mU (2 μM)) or vehicle and placed in the neutral compartment of the CPP boxes. Preference scores were calculated by subtracting the time spent in the food-paired chamber from the time spent in the un-paired chamber. Intra-VTA insulin significantly reduced preference scores compared (n = 9; p < 0.05). Scores present group means ± s.e.m.

Comment in

Similar articles

Cited by

References

    1. Gerozissis K. Brain insulin, energy and glucose homeostasis; genes, environment and metabolic pathologies. Eur J Pharmacol. 2008;585:38–49. - PubMed
    1. Palmiter RD. Is dopamine a physiologically relevant mediator of feeding behavior? Trends Neurosci. 2007;30:375–381. - PubMed
    1. Bonci A, Malenka RC. Properties and plasticity of excitatory synapses on dopaminergic and GABAergic cells in the ventral tegmental area. J Neurosci. 1999;19:3723–3730. - PMC - PubMed
    1. Overton PG, Richards CD, Berry MS, Clark D. Long-term potentiation at excitatory amino acid synapses on midbrain dopamine neurons. Neuroreport. 1999;10:221–226. - PubMed
    1. Borgland SL, et al. Orexin A/hypocretin-1 selectively promotes motivation for positive reinforcers. J Neurosci. 2009;29:11215–11225. - PMC - PubMed

Publication types

MeSH terms