. 2013 Mar;16(3):332-9.
doi: 10.1038/nn.3322. Epub 2013 Jan 27.

Experience-dependent modification of a central amygdala fear circuit

Affiliations

Experience-dependent modification of a central amygdala fear circuit

Haohong Li et al. Nat Neurosci. 2013 Mar.

Abstract

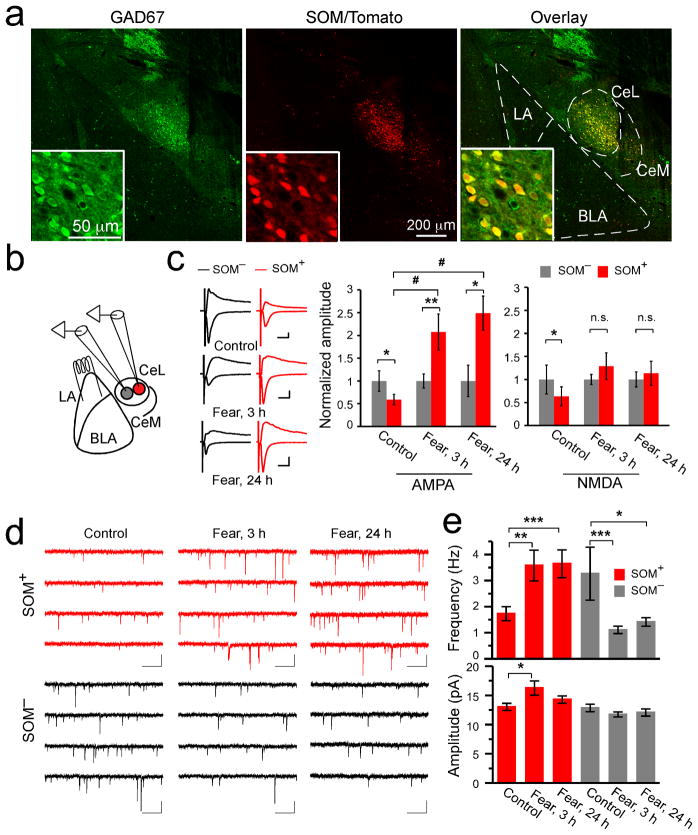
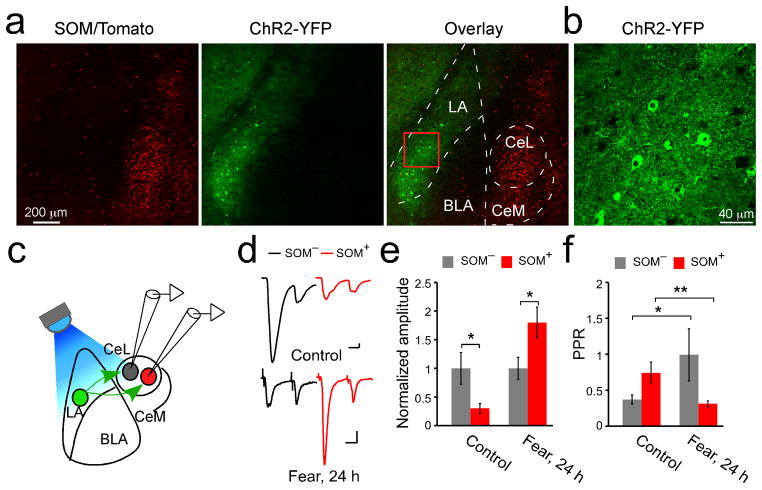
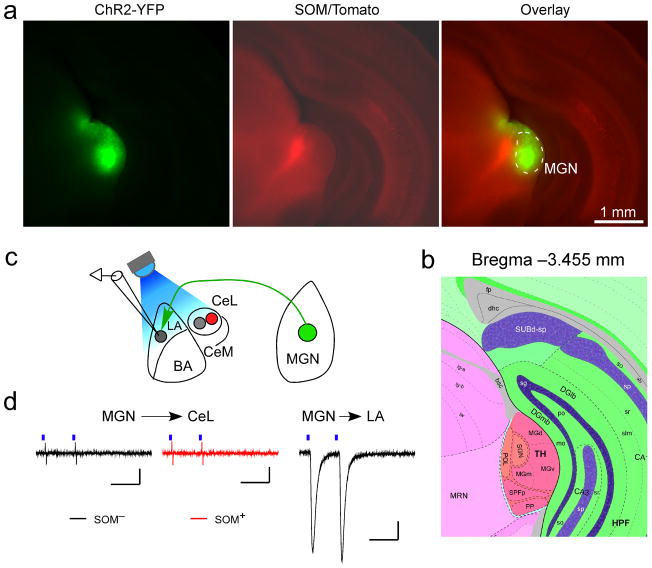
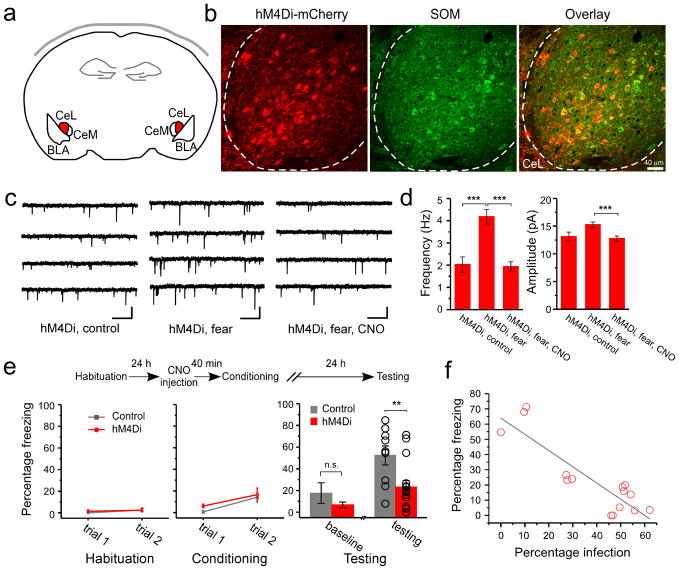
The amygdala is essential for fear learning and expression. The central amygdala (CeA), once viewed as a passive relay between the amygdala complex and downstream fear effectors, has emerged as an active participant in fear conditioning. However, the mechanism by which CeA contributes to the learning and expression of fear is unclear. We found that fear conditioning in mice induced robust plasticity of excitatory synapses onto inhibitory neurons in the lateral subdivision of the CeA (CeL). This experience-dependent plasticity was cell specific, bidirectional and expressed presynaptically by inputs from the lateral amygdala. In particular, preventing synaptic potentiation onto somatostatin-positive neurons impaired fear memory formation. Furthermore, activation of these neurons was necessary for fear memory recall and was sufficient to drive fear responses. Our findings support a model in which fear conditioning-induced synaptic modifications in CeL favor the activation of somatostatin-positive neurons, which inhibit CeL output, thereby disinhibiting the medial subdivision of CeA and releasing fear expression.


Conflict of interest statement

The authors declare no competing financial interests.

Figures

Figure 1
Figure 1. Fear conditioning induces modifications of excitatory synapses onto neurons in CeL
(a) A representative coronal brain section from the SOM-IRES-Cre/Ai14 mice stained with anti-GAD67 antibody (left). The SOM+ neurons expressed both tdTomato (middle) and GAD67 (see overlay in right). Inset: a portion of CeL shown in higher magnification. The borders of CeL, CeM, LA, and BLA are outlined. (b) A schematic recording configuration. In red is a SOM+ neuron. (c) Left: representative EPSC traces recorded from SOM/SOM+ neuronal pairs in CeL of the following groups: control (control group, upper panel), “fear, 3 h” (3 hrs following fear conditioning, middle panel), and “fear, 24 h” (24 hrs following fear conditioning, lower panel). Calibrations: 50 pA and 20 ms. Middle: quantification of AMPAR-mediated EPSC amplitude, which was normalized to the mean EPSC amplitude of SOM neurons. SOM+ neurons had smaller AMPAR-mediated EPSC than SOM neurons in control animals, but this relationship was reversed in fear-conditioned animals (control: SOM, 1 ± 0.23, SOM+, 0.59 ± 0.12, n =13 pairs, 4 animals, t = 2.53, DF = 12, *P < 0.05, paired t-test; fear, 3 h: SOM, 1 ± 0.16, SOM+, 2.07 ± 0.40, n = 11 pairs, 3 animals, t = −3.42, DF = 10, **P<0.01, paired t-test; fear, 24 h: SOM, 1±0.34, SOM+, 2.49±0.37, n = 8 pairs, 2 animals, t = −2.94, DF = 7, *P < 0.05, paired t-test; #P < 0.05, F(2,29) = 11.7, one-way analysis of variance (ANOVA) followed by Tukey’s test). Right: quantification of NMDAR-mediated EPSC. SOM+ neurons had smaller NMDAR-mediated EPSC than SOM neurons in control animals, but this difference disappeared in fear-conditioned animals (control: SOM, 1 ± 0.31, SOM+, 0.63 ± 0.20, n = 13 pairs, 4 animals, t = 2.75, DF = 12, *P < 0.05, paired t-test; fear, 3 h: SOM, 1± 0.11, SOM+, 1.3 ± 0.29, n = 11 pairs, 3 animals, t = −1.14, DF = 10, P > 0.05, paired t-test; fear, 24 h: SOM, 1 ± 0.16, SOM+, 1.13 ± 0.26, n = 7 pairs, 2 animals, t = −0.40, DF = 6, P > 0.05, paired t-test; n.s., non-significant). (d) Representative mEPSC traces recorded from SOM+ (red) and SOM(black) neurons in the CeL of different groups. Calibrations: 20 pA and 500 ms. (e) Upper panel: fear conditioning increased the mEPSC frequency of SOM+ neurons (SOM+, control: 1.73 ± 0.27 Hz, n = 15 cells, 3 animals; fear, 3 h: 3.58 ± 0.59 Hz, n = 15 cells, 3 animals; fear, 24 h: 3.64 ± 0.53 Hz, n = 12 cells, 3 animals; *P < 0.05, **P < 0.01, ***P < 0.001, bootstrap with Bonferroni correction), while decreased that of SOM neurons (SOM, control: 3.26 ± 1.02 Hz, n = 12 cells, 3 animals; fear, 3 h: 1.11 ± 0.14 Hz; n = 10 cells, 3 animals; fear, 24 h: 1.42 ± 0.16 Hz, n = 13 cells, 3 animals; *P < 0.05, ***P < 0.001, bootstrap with Bonferroni correction). Lower panel: fear conditioning increased the mEPSC amplitude of SOM+ neurons at 3 hrs after fear conditioning (SOM+, control: 13.03 ± 0.60 pA, n = 15 cells, 3 animals; fear, 3 h: 16.26 ± 1.21 pA, n = 15 cells, 3 animals; fear, 24 h: 14.28 ± 0.63 Hz, n = 12 cells, 3 animals; *P < 0.05, bootstrap with Bonferroni correction), but did not affect that of SOM neurons (SOM, control: 12.85 ± 0.64 pA, n = 12 cells, 3 animals; fear, 3 h: 11.74 ± 0.44 pA, n = 10 cells, 3 animals; fear, 24 h: 12.06 ± 0.61 Hz, n = 13 cells, 3 animals; P > 0.05, bootstrap). Fear, fear-conditioned. Error bars, s.e.m.
Figure 2
Figure 2. The fear conditioning-induced synaptic modifications in CeL are expressed presynaptically at the LA-CeL pathway
(a) Confocal images of a coronal brain section, which was recovered after electrophysiological recording (see c, d), from a SOM-IRES-Cre/Ai14 mouse injected with the AAV-CAG-ChR2(H134R)-YFP into the LA (middle). The SOM+ neurons expressed tdTomato (left, and overlay in right). The borders of CeL, CeM, LA, and BLA are outlined. (b) ChR2-YFP is expressed in many LA neurons. A higher magnification image of the boxed region in a (see overlay) is shown. (c) A schematic recording configuration. In green is a ChR2-YFP-positive neuron in LA, in red a SOM+ neuron in CeL. A blue LED (λ = 470 nm) was used to activate ChR2 and evoke the LA neuron-driven synaptic transmission, which is simultaneously recorded from SOM/SOM+ neuronal pairs in CeL. (d) Representative EPSCs, which were evoked by light stimulation of the LA–CeL pathway, were recorded from SOM/SOM+ neuronal pairs in the CeL, in control (upper panel) and “fear, 24 h” (24 hrs following fear conditioning, lower panel) groups. A paired-pulse stimulation protocol (50 ms inter-event-interval) was used. Calibrations: 20 pA and 20 ms. (e) Quantification of AMPAR-mediated EPSC amplitude (peak of the EPSC in response to the first pulse in the paired-pulse), which was normalized to the mean EPSC amplitude of SOM neurons. SOM+ neurons had smaller EPSC than SOM neurons in control animals (control: SOM, 1 ± 0.28, SOM+, 0.3 ± 0.08, n =14 pairs, 2 animals; t = 2.98, DF = 13, *P < 0.05, paired t-test), but this relationship was reversed in fear-conditioned animals (fear, 24 h: SOM, 1 ± 0.19, SOM+, 1.8 ± 0.27, n = 28 pairs, 3 animals; t = −2.42, DF = 27, *P<0.05, paired t-test). (f) Quantification of PPR. SOM neurons increased, whereas SOM+ neurons decreased PPR after fear conditioning (SOM, control: 0.37 ± 0.06, n = 14 cells, 2 animals, fear, 24 h: 0.99 ± 0.36, n = 22 cells, 3 animals; *P < 0.05, bootstrap; SOM+, control: 0.74 ± 0.15, n =11 cells, 2 animals, fear, 24 h: 0.31 ± 0.04, n = 26 cells, 3 animals; **P < 0.01, bootstrap). Error bars, s.e.m.
Figure 3
Figure 3. Auditory thalamus does not drive excitatory synaptic transmission onto CeL neurons
(a) Images of a coronal brain section, which was recovered from a brain used for making acute slices for recording (see c, d), from a SOM-IRES-Cre/Ai14 mouse injected with AAV-CAG-ChR2(H134R)-YFP into the medial geniculate nucleus (MGN) (left, and overlay in the right). Images were taken using an Olympus BX41 histology microscope with a 5x lens. Note the area infected with the virus was large and covered the entire MGN (see b) for the atlas). (b) A section of a brain atlas that contains the auditory thalamus, which is at Bregma −3.455 mm, a level approximately the same as that of the brain section shown in a. The atlas is adapted from the mouse Reference Atlas of Allen Brain Institute. (c) A schematic recording configuration. In green is a ChR2-positive neuron in MGN, in red a SOM+ neuron in CeL. (d) Left: representative EPSC traces recorded from a SOM (black) and a SOM+ (red) neuron in the CeL. Out of 11 SOM (2 animals) and 11 SOM+ (2 animals) neurons recorded in CeL, none had any measurable EPSCs. Right: a representative EPSC trace recorded from an LA neuron in the same slice as that used in the left. EPSCs could be readily evoked for all 17 neurons (2 animals) recorded in LA (EPSC amplitude: 154.2 ± 36.6 pA, mean±s.e.m.). Blue bars indicate light pulses (2 ms). Calibrations: 20 pA and 50 ms.
Figure 4
Figure 4. Synaptic potentiation onto SOM+ neurons in CeL is required for the formation of fear memory
The SOM-IRES-Cre mice were used in these experiments. (a) A schematic experimental design. The hM4Di-mCherry is expressed in SOM+ neurons in CeL (shown in red) by viral infection. (b) An example image of the SOM+ neurons in CeL infected with the AAV-DIO-hM4Di-mCherry virus. Left: expression of hM4Di (red) was detected based on the intrinsic fluorescence of mCherry. Middle: SOM+ neurons (green) were recognized by an antibody against SOM. Right: Only SOM+ neurons expressed hM4Di, as indicated by the overlapping of red and green signals. Dashed lines mark the border of CeL. Coronal sections. (c) Representative mEPSC traces recorded from SOM+ CeL neurons expressing hM4Di-mCherry, in the following groups: “hM4Di, control” (control), “hM4Di, fear” (fear conditioning), and “hM4Di, fear, CNO” (fear conditioning with CNO pre-treatment). For the fear conditioning groups, acute brain slices were prepared 3 hr following fear conditioning. Calibrations: 20 pA and 500 ms. (d) Left: CNO pre-treatment suppressed the fear conditioning-induced increase in mEPSC frequency in SOM+ neurons that expressed hM4Di (control: 2.02 ± 0.35 Hz, n = 11 cells, 3 animals; fear: 4.18 ± 0.33 Hz, n = 15 cells, 3 animals; fear, CNO: 1.93 ± 0.22 Hz, n = 12 cells, 3 animals; ***P < 0.001, bootstrap with Bonferroni correction). Right: CNO pre-treatment also suppressed the fear conditioning-induced increase in mEPSC amplitude in SOM+ neurons that expressed hM4Di (control: 13.1 ± 0.81 Hz, n = 11 cells, 3 animals; fear: 15.24 ± 0.51 Hz, n = 15 cells, 3 animals; fear, CNO: 12.75 ± 0.47 Hz, n = 12 cells, 3 animals; ***P < 0.001, bootstrap with Bonferroni correction). (e) Top: A schematic experimental procedure. Bottom left & middle: freezing behavior during habituation and conditioning. Control: SOM-IRES-Cre mice that received AAV-DIO-GFP injection bilaterally into CeL. hM4Di: SOM-IRES-Cre mice that received AAV-DIO-hM4Di injection bilaterally into CeL. Freezing responses were similar for the two groups at the end of conditioning (control, 14.2 ± 4.9%, n = 9 animals; hM4Di, 16.6 ± 6.1%, n = 15 animals; P > 0.05, t-test). Bottom right: the hM4Di mice showed impaired fear memory recall compared with control (control, 52.36 ± 8.76%, n = 9 animals; hM4Di, 23.24 ± 6.05%, n = 15 animals; t = 2.82, DF = 22, **P < 0.01, t-test). The two groups did not differ significantly in their baseline freezing levels (control, 17.56 ± 9.62%, n = 9 animals; hM4Di, 6.67 ± 2.37%, n = 15 animals; P > 0.05, t-test). (f) The freezing level of individual animals correlated with the extent of infection, measured as the fraction of SOM+ CeL neurons that expressed hMD4i-mCherry (R2 = 0.76, F(1,13) = 45.62, grey line; P < 0.001 by a linear regression; n = 15 animals). The extent of infection for the left and right CeL was averaged. Error bars, s.e.m.
Figure 5
Figure 5. SOM+ CeL neurons do not project to CeM
(a) CTB (green) was injected into the CeM of a SOM-IRES-Cre/Ai14 mouse (similar results were obtained from 2 animals). Coronal brain section (at ~Bregma −1.00 mm). (b) Images of a brain section from the same mouse (at ~Bregma −1.22 mm). Left, the SOM+ neurons expressed tdTomato (red). Middle, extensive labeling by CTB (green) was seen in CeL. Right, overlay; the box in CeL marks the region shown in c at higher magnification. (c) Higher magnification images of the boxed region in CeL in b. The vast majority of the CTB-labeled neurons (green) in CeL were not SOM+ (red; see overlay in right).
Figure 6
Figure 6. SOM+ CeL neurons do not inhibit CeM neurons that project to PAG
(a) A schematic recording configuration. In green is a SOM+ neuron that expresses ChR2-YFP. Recordings were made onto CeL or CeM neurons that did (SOM+ cells) or did not (SOM cells) express ChR2-YFP. Holding potential was set at 0 mV, which is the reversal potential of ChR2. A blue LED (λ = 470 nm), the beam size of which was restricted to ~50 μm in diameter by a shutter (see e), was used to activate ChR2-expressing cells in multiple locations that together covered the entire CeL. (b) A coronal brain section from a SOM-IRES-Cre/Ai32 mouse, in which the ChR2-YFP was specifically and uniformly expressed in SOM+ cells. Prominent labeling with ChR2-YFP was seen in cell bodies and fibers in CeL. Weak labeling of fibers was occasionally observed in CeM. On the right is a higher magnification image of the CeL area. (c) Representative IPSC traces recorded from a CeL neuron, a randomly recorded CeM neuron (CeM, random), and a PAG-projecting CeM neuron (CeM, PAG), respectively. IPSCs were evoked by 2-ms light pulses (denoted by the blue bars) from an LED set at a constant power for all recordings. Calibrations: 100 pA and 50 ms. (d) Quantification of the amplitude of IPSCs in CeL neurons in response to the focal stimulation of SOM+ cells in different locations of CeL. X-axis is the distances (in μm) between the soma of the recorded cells and the center of stimulation. Each circle represents an IPSC of one cell in response to the stimulation of one location (red squares: mean ± s.e.m, n = 17 cells, 3 animals). All neurons recorded in CeL showed robust IPSCs for all stimulation locations. In contrast, only 4 out of 40 randomly recorded CeM cells (from 3 animals) had measurable IPSCs (not shown), while none (0 out of 16 cells, 1 animal) of the PAG-projecting CeM cells showed any measurable IPSCs. (e) An image showing the field of illumination by the LED light beam used for the light stimulation in CeL. The ChR2-YFP-expressing cells are clearly visible. (f) Left: image of a coronal brain section containing CeM. The brain section was prepared from a SOM-IRES-cre/Ai32 mouse, in which the CTB conjugated to the dye Alexa Fluor 594 was injected into the PAG. Middle: the boxed region in CeM is shown in higher magnification. The CTB-labeled PAG-projecting neurons are red fluorescent. Right: an image of the brain section containing PAG. Arrowhead indicates the site of CTB injection. DRN: dorsal raphe nucleus. Error bars, s.e.m.
Figure 7
Figure 7. SOM+ neurons in CeL control the expression of fear
The SOM-IRES-Cre mice were used in these experiments. (a) A schematic diagram showing the experimental design. ChR2-YFP (or Arch-GFP) was expressed in SOM+ neurons in CeL (shown in green) by viral infection. Optic fibers were chronically implanted bilaterally in CeL, and were connected to a blue (for ChR2 activation) or a green (for Arch activation, not shown) laser source. (b) An example image of the SOM+ neurons in CeL infected with the AAV-DIO-ChR2(H134R)-YFP virus. Dashed lines mark the border of CeL. (c) Activation of SOM+ CeL neurons induced fear-like responses in naïve animals. Left: freezing behavior was measured, in repeated trials, before and during the delivery of blue light pulses (blue bars) into the CeL. Delivery of light into CeL induced freezing behavior in animals injected with the AAV-DIO-ChR2(H134R)-YFP virus (ChR2 group, top), but not in animals injected with the AAV-GFP virus (Control group, bottom). Right: level of freezing was averaged for ChR2 animals (top; light off, 13.50 ± 2.63%, light on, 53.50 ± 5.90%, n = 5 animals, t = −7.95, DF = 4, **P < 0.01, paired t-test) and control animals (bottom; light off, 12.25 ± 4.13%, light on, 14.00 ± 4.30%, n = 4 animals, t = −1.13, DF = 3, P > 0.05, paired t-test). (d) An example of the SOM+ neurons in CeL infected with the AAV-DIO-Arch-GFP. Dashed lines mark the border of CeL. (e) Inhibition of SOM+ CeL neurons suppressed conditioned fear expression. Top: a schematic experimental procedure, in which animals were first trained with the fear-conditioning paradigm, and 24 h later tested for fear memory recall. Middle and Bottom panels: animals injected with the AAV-DIO-Arch-GFP (Arch group, middle) or the AAV-GFP virus (Control group, bottom) were fear conditioned (left) and then tested (right). During testing, conditioned freezing was measured in two trials, the first of which was conducted during the delivery of a green light into CeL (light on). Delivery of light into CeL suppressed conditioned freezing in the Arch group (light on: 20.20 ± 7.69%, light off: 45.3 ± 12.91%, n = 5 animals, t = −3.72, DF = 4, *P < 0.05, paired t-test), but not in the control group (light on, 66.25 ± 11.11%, light off, 50.00 ± 6.77%, n = 4 animals, t = 2.39, DF = 3, P > 0.05, paired t-test). n.s. not significant, Error bars, s.e.m.

References

    1. LeDoux JE. Emotion circuits in the brain. Annual review of neuroscience. 2000;23:155–84. - PubMed
    1. Davis M. The role of the amygdala in conditioned and unconditioned fear and anxiety. In: Aggleton JP, editor. The Amygdala. Oxford UP; Oxford: 2000. pp. 213–287.
    1. Davis M, Whalen PJ. The amygdala: vigilance and emotion. Molecular Psychiatry. 2001;6:13–34. - PubMed
    1. Maren S, Quirk GJ. Neuronal signalling of fear memory. Nature reviews Neuroscience. 2004;5:844–52. - PubMed
    1. LeDoux J. The amygdala. Current biology: CB. 2007;17:R868–74. - PubMed

Publication types