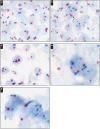
Colorimetric in situ hybridization identifies MYC gene signal clusters correlating with increased copy number, mRNA, and protein in diffuse large B-cell lymphoma
- PMID: 23355209
- PMCID: PMC3971877
- DOI: 10.1309/AJCP2Z0TAGMUYJEB
Colorimetric in situ hybridization identifies MYC gene signal clusters correlating with increased copy number, mRNA, and protein in diffuse large B-cell lymphoma
Abstract
Abnormalities of the MYC oncogene on chromosome 8 are characteristic of Burkitt lymphoma and other aggressive B-cell lymphomas, including diffuse large B-cell lymphoma (DLBCL). We recently described a colorimetric in situ hybridization (CISH) method for detecting extra copies of the MYC gene in DLBCL and the frequent occurrence of excess copies of discrete MYC signals in the context of diploidy or polyploidy of chromosome 8, which correlated with increased mRNA signals. We further observed enlarged MYC signals, which were counted as a single gene copy but, by their dimension and unusual shape, likely consisted of "clusters" of MYC genes. In this study, we sought to further characterize these clusters of MYC signals by determining whether the presence of these correlated with other genetic features, mRNA levels, protein, and overall survival. We found that MYC clusters correlated with an abnormal MYC locus and with increased mRNA. MYC mRNA correlated with protein levels, and both increased mRNA and protein correlated with poorer overall survival. MYC clusters were seen in both the germinal center and activated B-cell subtypes of DLBCL. Clusters of MYC signals may be an underappreciated, but clinically important, feature of aggressive B-cell lymphomas with potential prognostic and therapeutic relevance.
Figures


Similar articles
-
[B-cell lymphomas with concurrent myc and bcl-2/IgH or bcl-6 translocations].Zhonghua Bing Li Xue Za Zhi. 2013 Sep;42(9):584-8. Zhonghua Bing Li Xue Za Zhi. 2013. PMID: 24314242 Chinese.
-
Immunohistochemical double-hit score is a strong predictor of outcome in patients with diffuse large B-cell lymphoma treated with rituximab plus cyclophosphamide, doxorubicin, vincristine, and prednisone.J Clin Oncol. 2012 Oct 1;30(28):3460-7. doi: 10.1200/JCO.2011.41.4342. Epub 2012 Jun 4. J Clin Oncol. 2012. PMID: 22665537
-
[Significance and application of c-myc in diffuse large B-cell lymphoma].Zhonghua Bing Li Xue Za Zhi. 2013 Sep;42(9):638-40. Zhonghua Bing Li Xue Za Zhi. 2013. PMID: 24314257 Review. Chinese. No abstract available.
-
Concurrent expression of MYC and BCL2 in diffuse large B-cell lymphoma treated with rituximab plus cyclophosphamide, doxorubicin, vincristine, and prednisone.J Clin Oncol. 2012 Oct 1;30(28):3452-9. doi: 10.1200/JCO.2011.41.0985. Epub 2012 Jul 30. J Clin Oncol. 2012. PMID: 22851565 Free PMC article.
-
The Spectrum of MYC Alterations in Diffuse Large B-Cell Lymphoma.Acta Haematol. 2020;143(6):520-528. doi: 10.1159/000505892. Epub 2020 Feb 19. Acta Haematol. 2020. PMID: 32074595 Review.
Cited by
-
Genomic Analysis of Lymphoma Risk in Bullmastiff Dogs.Vet Sci. 2023 Dec 14;10(12):703. doi: 10.3390/vetsci10120703. Vet Sci. 2023. PMID: 38133254 Free PMC article.
-
MYC Analysis by Fluorescent In Situ Hybridization and Immunohistochemistry in Primary Adrenal Angiosarcoma (PAA): a Series of Four Cases.Endocr Pathol. 2015 Dec;26(4):334-41. doi: 10.1007/s12022-015-9385-4. Endocr Pathol. 2015. PMID: 26223194
-
C-MYC aberrations as prognostic factors in diffuse large B-cell lymphoma: a meta-analysis of epidemiological studies.PLoS One. 2014 Apr 16;9(4):e95020. doi: 10.1371/journal.pone.0095020. eCollection 2014. PLoS One. 2014. PMID: 24740248 Free PMC article.
-
BCL2 antibodies targeted at different epitopes detect varying levels of protein expression and correlate with frequent gene amplification in diffuse large B-cell lymphoma.Hum Pathol. 2014 Oct;45(10):2144-53. doi: 10.1016/j.humpath.2014.06.005. Epub 2014 Jun 26. Hum Pathol. 2014. PMID: 25090918 Free PMC article.
-
Clinicopathologic and prognostic significance of c-MYC copy number gain in lung adenocarcinomas.Br J Cancer. 2014 May 27;110(11):2688-99. doi: 10.1038/bjc.2014.218. Epub 2014 May 8. Br J Cancer. 2014. PMID: 24809777 Free PMC article.
References
-
- Slack GW, Gascoyne RD. MYC and aggressive B-cell lymphomas. Adv Anat Pathol. 2011;18:219–228. - PubMed
-
- Jaffe ES. WHO Classification of Tumours, Pathology and Genetics, Tumours of Haematopoietic and Lymphoid Tissues. IARC Press; Lyon, France: 2001.
-
- Yoon SO, Jeon YK, Paik JH, et al. MYC translocation and an increased copy number predict poor prognosis in adult diffuse large B-cell lymphoma (DLBCL), especially in germinal centre-like B cell (GCB) type. Histopathology. 2008;53:205–217. - PubMed
Publication types
MeSH terms
Substances
Supplementary concepts
Grants and funding
LinkOut - more resources
Full Text Sources
Other Literature Sources

