. 1990 May 15;265(14):8190-7.

Cloning and regulation of cholesterol 7 alpha-hydroxylase, the rate-limiting enzyme in bile acid biosynthesis

Affiliations

Cloning and regulation of cholesterol 7 alpha-hydroxylase, the rate-limiting enzyme in bile acid biosynthesis

D F Jelinek et al. J Biol Chem. .

Abstract

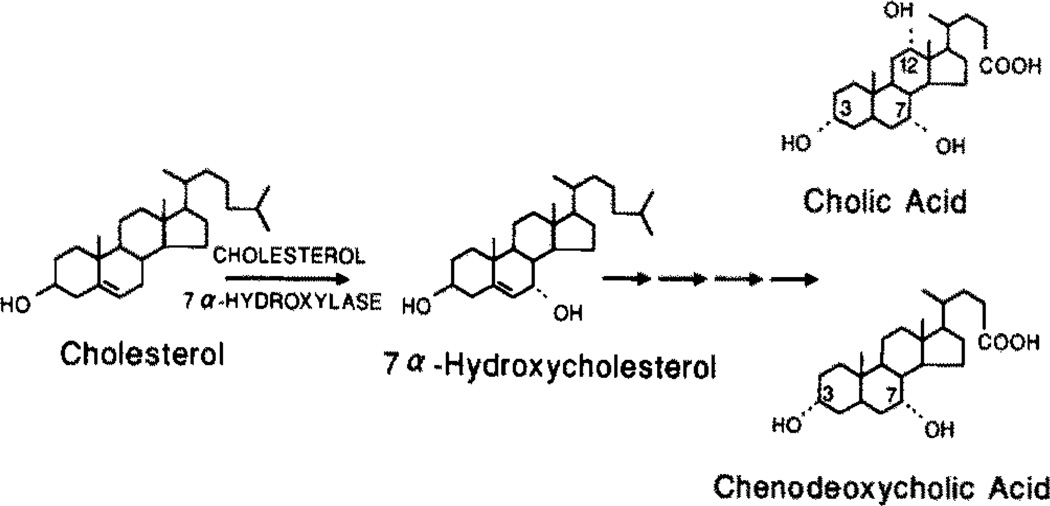
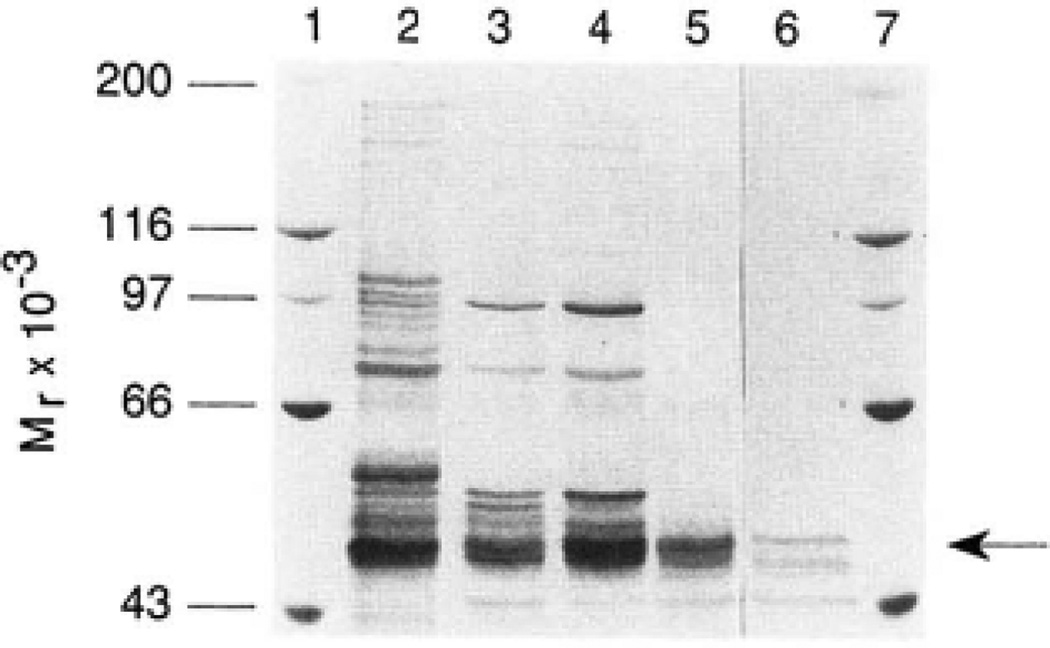
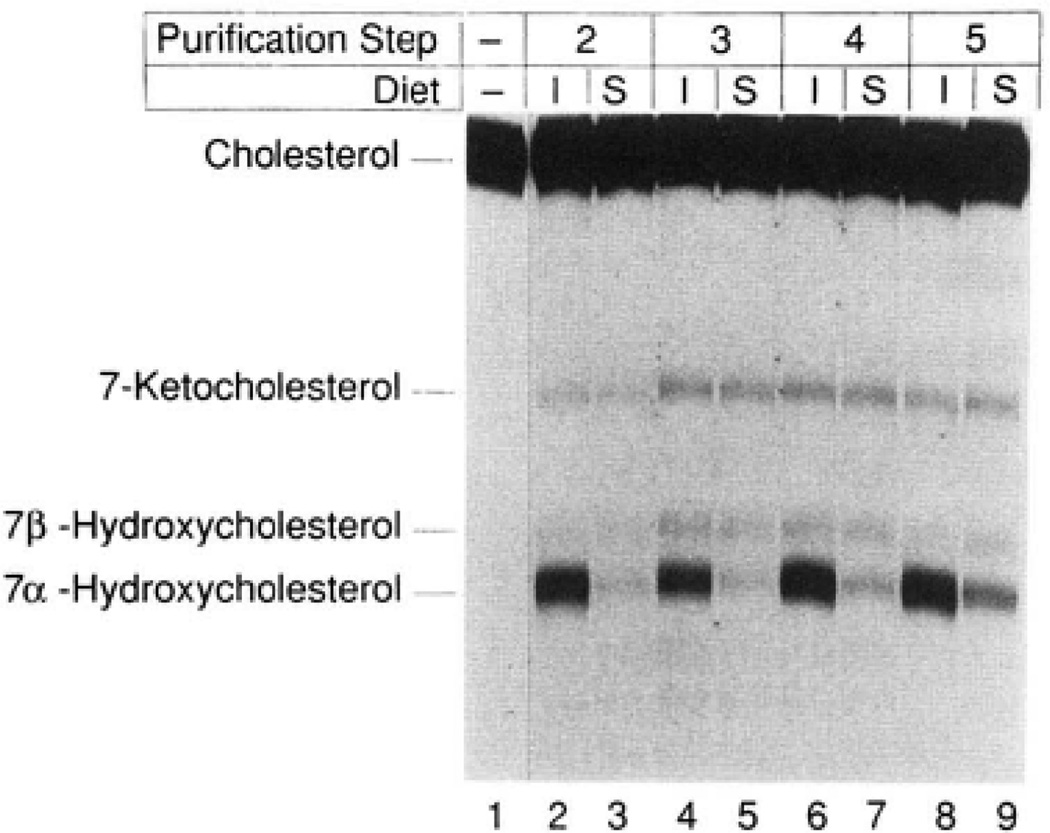
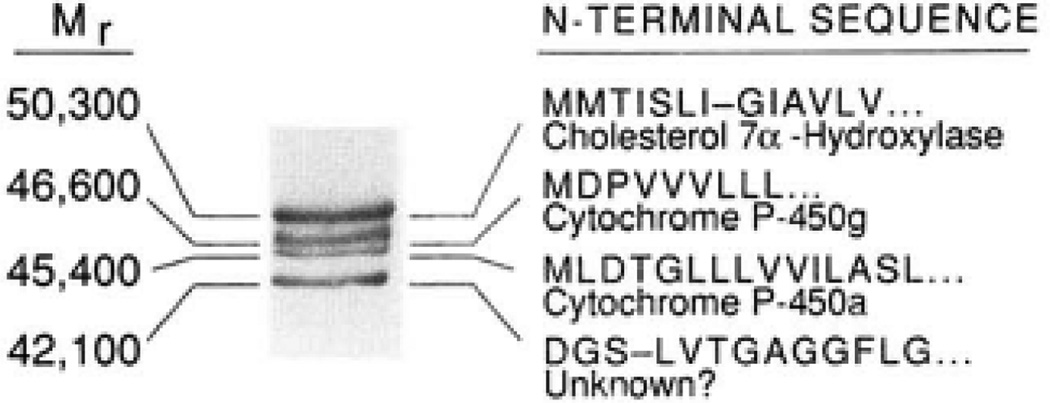
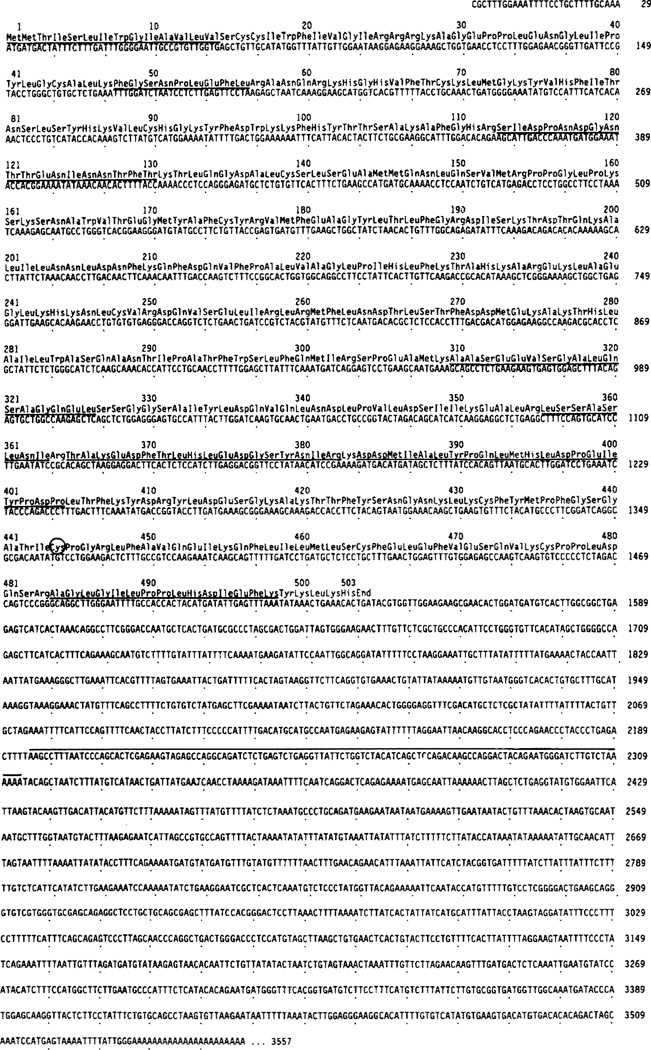
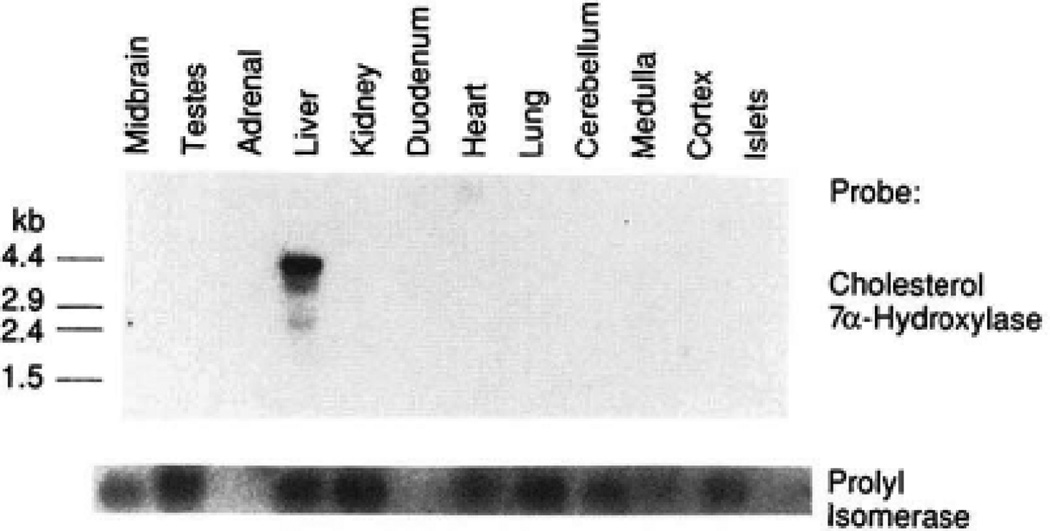
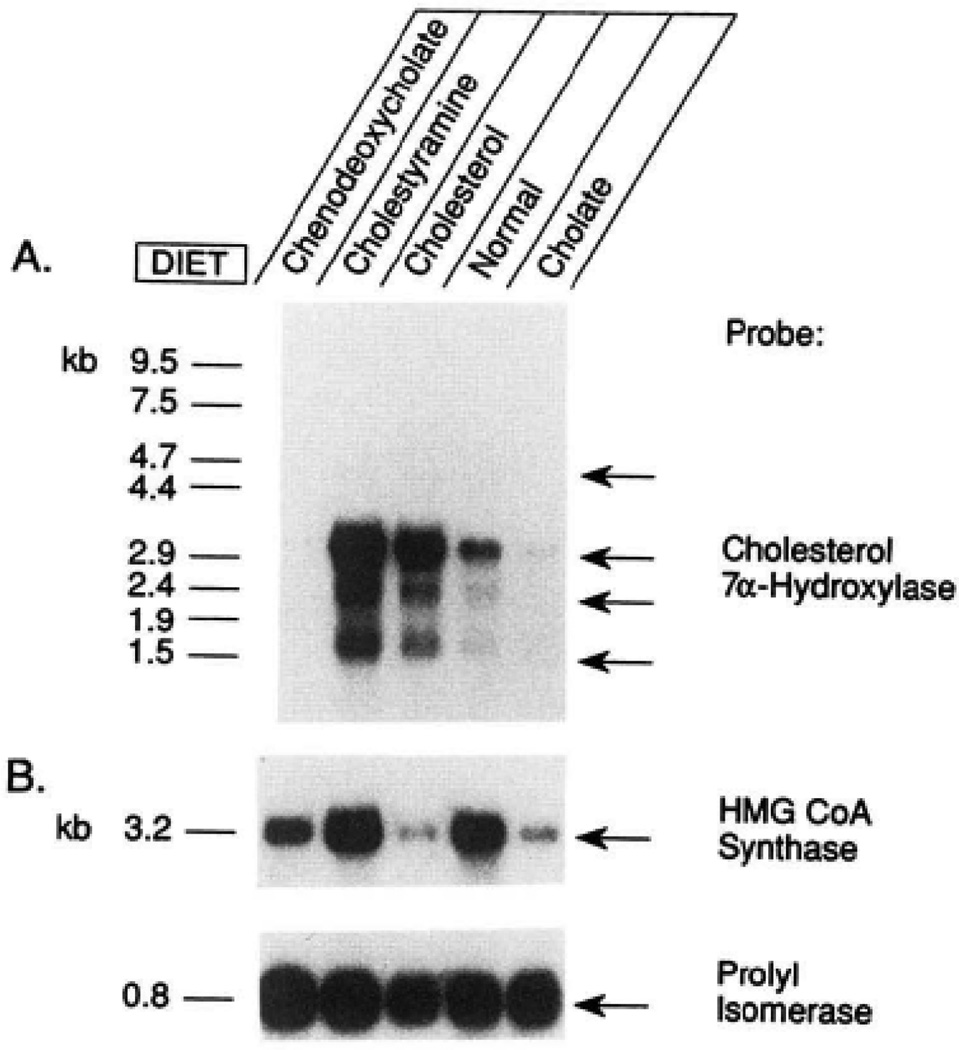
The rate-limiting step in bile acid biosynthesis is catalyzed by the microsomal cytochrome P-450 cholesterol 7 alpha-hydroxylase (7 alpha-hydroxylase). The expression of this enzyme is subject to feedback regulation by sterols and is thought to be coordinately regulated with enzymes in the cholesterol supply pathways, including the low density lipoprotein receptor and 3-hydroxy-3-methylglutaryl-coenzyme A reductase and synthase. Here we report the purification of rat 7 alpha-hydroxylase and the determination of a partial amino acid sequence. Oligonucleotides derived from peptide sequence were used to clone a full-length cDNA encoding 7 alpha-hydroxylase. DNA sequence analysis of the cDNA revealed a 7 alpha-hydroxylase protein of 503 amino acids with a predicted molecular weight of 56,890 which represents a novel family of cytochrome P-450 enzymes. Transfection of a 7 alpha-hydroxylase cDNA into simian COS cells resulted in the synthesis of a functional enzyme whose activity was stimulated in vitro by the addition of rat microsomal cytochrome P-450 reductase protein. RNA blot hybridization experiments indicated that the mRNA for 7 alpha-hydroxylase is found only in the liver. The levels of this mRNA increased when bile acids were depleted by dietary cholestyramine and decreased when bile acids were consumed. Dietary cholesterol led to an increase in 7 alpha-hydroxylase mRNA levels. The enzymatic activity of 7 alpha-hydroxylase paralleled the observed changes in mRNA levels. These results suggest that bile acids and sterols are able to alter the transcription of the 7 alpha-hydroxylase gene and that this control explains the previously observed feedback regulation of bile acid synthesis.


Figures

Fig. 1
Fig. 1. The biosynthesis of bile acids from cholesterol
The primary bile acids cholic acid and chenodeoxycholic acid are synthesized from cholesterol in the liver via the actions of 10 or more different enzymes (9). Cholesterol 7α-hydroxylase converts cholesterol into 7α-hydroxycholesterol and constitutes the rate-limiting step in the pathway.
Fig. 2
Fig. 2. SDS-polyacrylamide gel electrophoresis of 7α-hydroxylase protein at various stages of purification
20 µg of rat microsomal 8–17% polyethylene glycol precipitate (lane 2), 2.5 µg of aminohexyl-Sepharose fraction (lane 3), 5.0 µg of hydroxy1apatite fraction (lane 4), 1.5 µg of DEAE-Sepharose fraction (lane 5), and 1.0 µg of postmonoclonal antibody 2B4 fraction (lane 6) were electrophoresed on a 7% SDS-polyacrylamide gel and subsequently visualized by silver staining. The molecular weights of protein standards (lanes 1 and 7) are indicated on the left of the stained gel. The 7α-hydroxylase protein is indicated by an arrow on the right.
Fig. 3
Fig. 3. Dietary regulation of 7α-hydroxylase enzyme activity
7α-Hydroxylase was simultaneously purified from groups of 100 animals maintained for 2 weeks on rat chow supplemented with 2% cholestyramine (induced, I) or 0.2% chenodeoxycholic acid (suppressed, S) as described under “Experimental Procedures.” An equal amount of protein derived from the two groups at different purification steps was assayed for 7α-hydroxylase activity by thin layer chromatography. The purification steps correspond to those of Table I, Approximately 500 µg of protein from step 2 (lanes 2 and 3), 7 µg from step 3 (lanes 4 and 5), 6 µg from step 4 (lanes 6 and 7), and 1 µg from step 5 (lanes 8 and 9) were assayed for 5 min at 37 °C in a reaction containing 25 µM [14C] cholesterol and 1000 units of cytochrome P-450 reductase. Lane 1 contained only the starting isotope and was not subjected to solvent evaporation. The chromatogram was exposed to Kodak XAR-5 film for a period of 44 h at −70 °C. The identities of the observed sterols are indicated on the left and were determined by comparison with authentic standards. The 7-keto and 7β-hydroxylated forms of cholesterol represent spontaneous oxidation products derived from cholesterol during solvent evaporation in the workup of the various reactions.
Fig. 4
Fig. 4. Protein sequencing of 7α-hydroxylase
A Coomassie Blue-stained gel of 20 µg of step 6-purified material (Table I) is shown together with the amino-terminal sequences determined from each of the four major proteins remaining at this stage of the purification. The calculated molecular weight of each protein is shown on the left. The identities of cytochrome P-450a and cytochrome P-450g were determined by comparison of their deduced amino-terminal sequences with those in the National Biomedical Research Foundation protein data base and by enzyme assay (see “Results”).
Fig. 5
Fig. 5. Nucleotide sequence of the rat 7α-hydroxylase cDNA and predicted protein sequence
Amino acids are numbered above the sequence, and nucleotides are numbered on the right. A dot is placed under every 10th nucleotide. Protein sequence determined from the amino terminus and from seven tryptic peptides is underlined. The protein sequence deduced from the cDNA matched that determined by Edman degradation (Fig. 4 and Table II) with the exception of the 14th residue of tryptic peptide 6, which was valine in the peptide and glycine (residue 323) in the cDNA. A cysteine residue found in all cytochrome P-450 enzymes is circled at position 444. An Alu sequence in the 3′-untranslated region is overlined.
Fig. 6
Fig. 6. Tissue distribution of 7α-hydroxylase mRNA
Top, RNA was isolated from the indicated tissue or region of the brain by a guanidinium/CsCl procedure (17). Approximately 5 µg of polyadenylated RNA from each source was denatured with glyoxal and size fractionated by electrophoresis in a 1.5% agarose gel. Following transfer to a nylon membrane, hybridization was carried out with 32P-labeled single-stranded probes (21) derived from the coding region of the 7α-hydroxylase cDNA. The filter was washed as described previously (21) and subjected to autoradiography with intensifying screens at −70 °C for 96 h. Bottom, the blot from panel A was stripped of 32P radioactivity and reprobed with a cDNA corresponding to the cis-trans-prolyl isomerase mRNA. For the tissues that had low levels of this mRNA (adrenal, duodenum, pancreatic islets), previous studies with this same filter have shown that β-actin mRNA was present in these lanes (32).
Fig. 7
Fig. 7. Dietary regulation of hepatic 7α-hydroxylase mRNA levels
Polyadenylated RNA was isolated from the livers of animals maintained on the indicated diets, and 10 µg aliquots were subjected to blot analysis as described in the legend to Fig. 6. The filter was initially probed with 32P-labeled cDNAs for 7α-hydroxylase (panel A) and subsequently stripped and reprobed with cDNAs for the HMG-CoA synthase (plasmid p53K-3, Ref. 33) and cis-trans-prolyl isomerase mRNAs (panel B). The positions to which RNA standards of known size migrated in an adjacent lane are indicated on the left of panel A. These same standards were used to estimate the sizes of the HMG-CoA synthase and cis-trans-prolyl isomerase mRNAs shown in panel B.

Similar articles

Cited by

References

    1. Dietschy JM, Wilson JD. N. Engl. J. Med. 1970;282:1128–1138. - PubMed
    1. Brown MS, Goldstein JL. Science. 1986;232:34–47. - PubMed
    1. Brown MS, Goldstein JL. J. Lipid. Res. 1980;21:505–517. - PubMed
    1. Carey MC. In: The Liver: Biology and Pathobiology. Arias IM, Popper H, Schachter D, Shafritz DA, editors. New York: Raven Press; 1982. pp. 429–465.
    1. Südhof TC, Russell DW, Brown MS, Goldstein JL. Cell. 1987;48:1061–1069. - PubMed

Publication types

MeSH terms

Associated data