

Simultaneous pharmacokinetic model for rolofylline and both M1-trans and M1-cis metabolites
- PMID: 23355301
- PMCID: PMC3675731
- DOI: 10.1208/s12248-012-9443-5
Simultaneous pharmacokinetic model for rolofylline and both M1-trans and M1-cis metabolites
Abstract
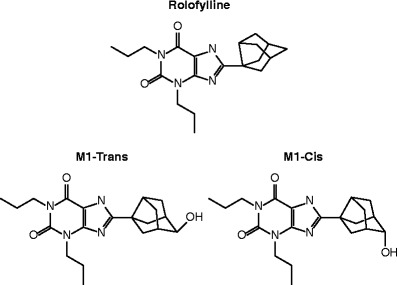
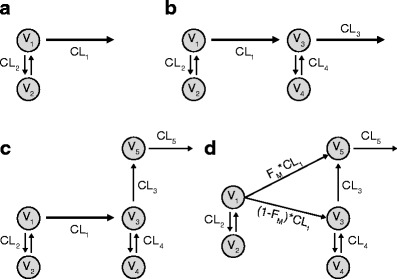
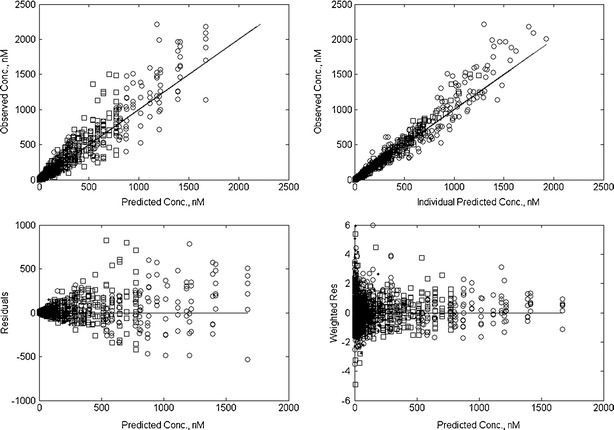
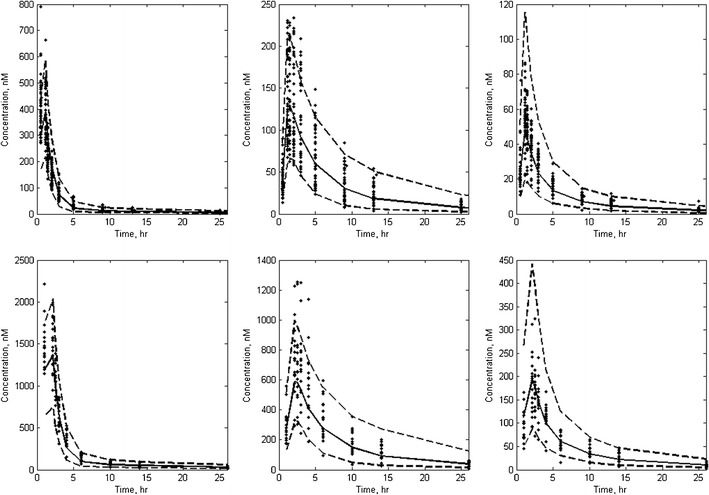
Rolofylline is a potent, selective adenosine A1 receptor antagonist that was under development for the treatment of patients with acute congestive heart failure and renal impairment. Rolofylline is metabolized primarily to the pharmacologically active M1-trans and M1-cis metabolites (metabolites) by cytochrome P450 (CYP) 3A4. The aim of this investigation was to provide a pharmacokinetic (PK) model for rolofylline and metabolites following intravenous administration to healthy volunteers. Data included for this investigation came from a randomized, double-blind, dose-escalation trial in four groups of healthy volunteers (N=36) where single doses of rolofylline, spanning 1 to 60 mg ,were infused over 1-2 h. The rolofylline and metabolite data were analyzed simultaneously using NONMEM. The simultaneous PK model comprised, in part, a two-compartment linear PK model for rolofylline, with estimates of clearance and volume of distribution at steady-state of 24.4 L/h and 239 L, respectively. In addition, the final PK model contained provisions for both conversion of rolofylline to metabolites and stereochemical conversion of M1-trans to M1-cis. Accordingly, the final model captured known aspects of rolofylline metabolism and was capable of simultaneously describing the PK of rolofylline and metabolites in healthy volunteers.
Figures
Similar articles
-
A single supratherapeutic dose of rolofylline does not prolong the QTcF interval in healthy volunteers.Am J Ther. 2010 Jan-Feb;17(1):8-16. doi: 10.1097/MJT.0b013e3181c3cbdb. Am J Ther. 2010. PMID: 20027105 Clinical Trial.
-
The effects of multiple doses of rolofylline on the single-dose pharmacokinetics of midazolam in healthy subjects.Am J Ther. 2010 Jan-Feb;17(1):53-60. doi: 10.1097/MJT.0b013e3181c12313. Am J Ther. 2010. PMID: 20027108 Clinical Trial.
-
The safety of an adenosine A(1)-receptor antagonist, rolofylline, in patients with acute heart failure and renal impairment: findings from PROTECT.Drug Saf. 2012 Mar 1;35(3):233-44. doi: 10.2165/11594680-000000000-00000. Drug Saf. 2012. PMID: 22339573 Clinical Trial.
-
Rolofylline: a selective adenosine 1 receptor antagonist for the treatment of heart failure.Expert Opin Pharmacother. 2009 Feb;10(2):311-22. doi: 10.1517/14656560802682213. Expert Opin Pharmacother. 2009. PMID: 19236201 Review.
-
Pharmacokinetic profile of dexloxiglumide.Clin Pharmacokinet. 2006;45(12):1177-88. doi: 10.2165/00003088-200645120-00003. Clin Pharmacokinet. 2006. PMID: 17112294 Review.
Cited by
-
Sex-related pharmacokinetic differences and mechanisms of metapristone (RU486 metabolite).Sci Rep. 2017 Dec 7;7(1):17190. doi: 10.1038/s41598-017-17225-0. Sci Rep. 2017. PMID: 29215040 Free PMC article.
References
-
- Cotter G, Dittrich HC, Weatherley BD, Bloomfield DM, O’Connor CM, Metra M, et al. The PROTECT pilot study: a randomized, placebo-controlled, dose-finding study of the adenosine A(1) receptor antagonist rolofylline in patients with acute heart failure and renal impairment. J Card Fail. 2008;14:631–640. doi: 10.1016/j.cardfail.2008.08.010. - DOI - PubMed
-
- Dittrich HC, Gupta DK, Hack TC, Dowling T, Callahan J, Thomson S. The effect of KW-3902, an adenosine A(1) receptor antagonist, on renal function and renal plasma flow in ambulatory patients with heart failure and renal impairment. J Card Fail. 2007;13:609–617. doi: 10.1016/j.cardfail.2007.08.006. - DOI - PubMed
Publication types
MeSH terms
Substances
LinkOut - more resources
Full Text Sources
Other Literature Sources
