. 2013 Apr 1;304(7):H966-82.
doi: 10.1152/ajpheart.00883.2012. Epub 2013 Jan 25.

Transplantation of autologously derived mitochondria protects the heart from ischemia-reperfusion injury

Affiliations

Transplantation of autologously derived mitochondria protects the heart from ischemia-reperfusion injury

Akihiro Masuzawa et al. Am J Physiol Heart Circ Physiol. .

Abstract

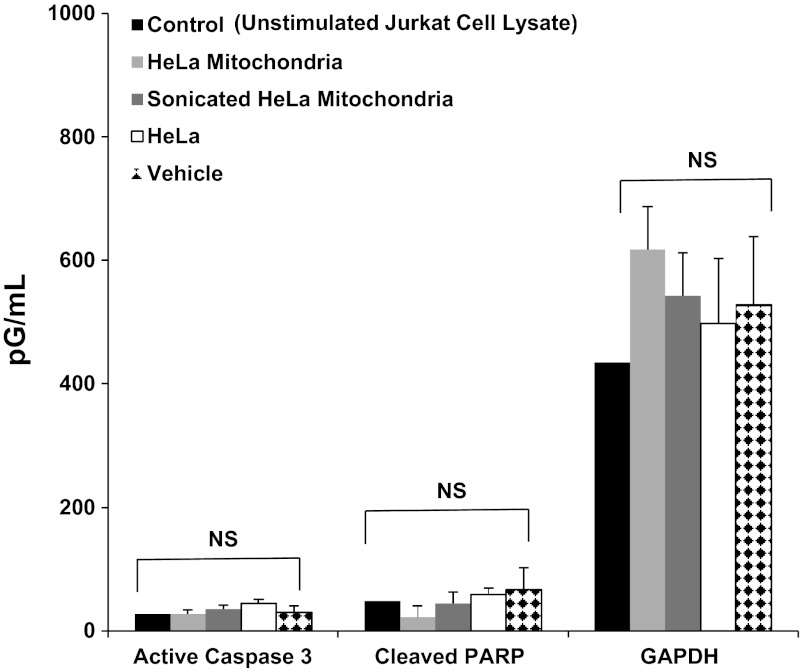
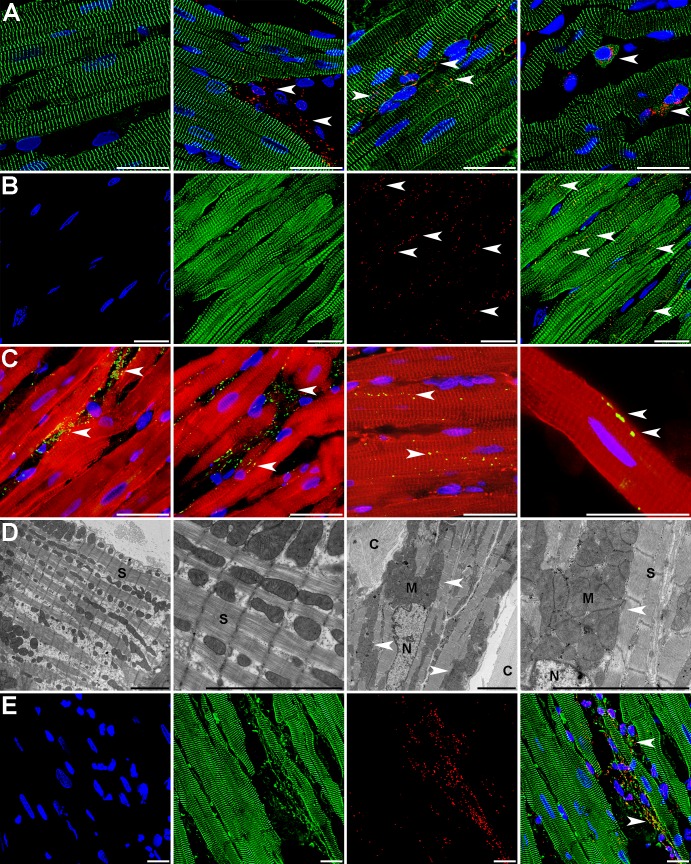
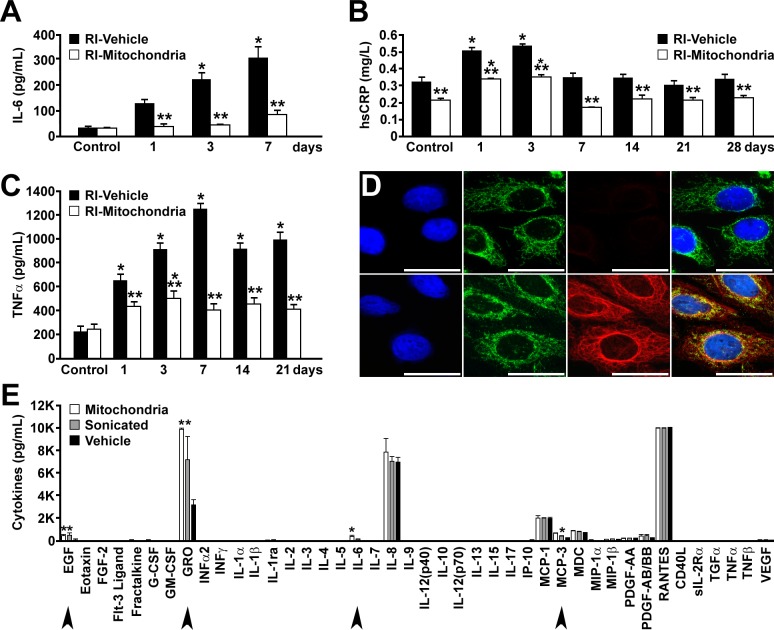
Mitochondrial damage and dysfunction occur during ischemia and modulate cardiac function and cell survival significantly during reperfusion. We hypothesized that transplantation of autologously derived mitochondria immediately prior to reperfusion would ameliorate these effects. New Zealand White rabbits were used for regional ischemia (RI), which was achieved by temporarily snaring the left anterior descending artery for 30 min. Following 29 min of RI, autologously derived mitochondria (RI-mitochondria; 9.7 ± 1.7 × 10(6)/ml) or vehicle alone (RI-vehicle) were injected directly into the RI zone, and the hearts were allowed to recover for 4 wk. Mitochondrial transplantation decreased (P < 0.05) creatine kinase MB, cardiac troponin-I, and apoptosis significantly in the RI zone. Infarct size following 4 wk of recovery was decreased significantly in RI-mitochondria (7.9 ± 2.9%) compared with RI-vehicle (34.2 ± 3.3%, P < 0.05). Serial echocardiograms showed that RI-mitochondria hearts returned to normal contraction within 10 min after reperfusion was started; however, RI-vehicle hearts showed persistent hypokinesia in the RI zone at 4 wk of recovery. Electrocardiogram and optical mapping studies showed that no arrhythmia was associated with autologously derived mitochondrial transplantation. In vivo and in vitro studies show that the transplanted mitochondria are evident in the interstitial spaces and are internalized by cardiomyocytes 2-8 h after transplantation. The transplanted mitochondria enhanced oxygen consumption, high-energy phosphate synthesis, and the induction of cytokine mediators and proteomic pathways that are important in preserving myocardial energetics, cell viability, and enhanced post-infarct cardiac function. Transplantation of autologously derived mitochondria provides a novel technique to protect the heart from ischemia-reperfusion injury.


Figures

Fig. 1.
Fig. 1.
Experimental protocol and mitochondrial isolation. A: New Zealand white rabbits (n = 33, male, 3–4 kg; Millbrook Farm, Amherst, MA) were used for in situ blood-perfused regional ischemia. There were no animal deaths or exclusions. Rabbits were sedated and then anesthetized, and a left mini-thoracotomy was performed. B: the pectoralis major was isolated, and 2 biopsy samples were obtained using a no. 6 biopsy punch and used for autologous mitochondria isolation. Representative tissue samples are shown. The hearts received eight 0.1-ml injections of either respiration buffer (RI-vehicle) or respiration buffer containing mitochondria (RI-mitochondria; 9.7 ± 1.7 × 10⁶ mitochondria) into the ischemic zone. Injections were made obliquely using an insulin syringe with a 28-gauge needle. At 30 min of regional ischemia, the snare was released and the animals were allowed to recover for 2 h or 28 days, and biochemical analysis, histology, and immunology was performed. Serial electrocardiograms, echocardiography, and blood samples were obtained for analysis. C: isolated mitochondria are shown under phase contrast illumination [bright field (BF)] at left and under fluorescence labeled with MitoTracker Red CMXRos (MTRed; middle). The merged image is shown at right. Mitochondrial viability was >99.99%. D: mitochondrial yield per gram tissue wet weight is shown. Correlation coefficient and slope intercept form are shown. E: transmission electron microscopy of isolated mitochondria (scale bars, 500 nm). *Isolated mitochondria were electron dense, with <0.01% of the mitochondria being fractured or damaged. FH: mitochondrial complex I–V (F), state 3 (active) oxygen consumption (ADP-stimulated respiration; G), and respiratory control index (state 3/state 4) for malate (complex I) and succinate induced (complex II) in energized autologously derived pectoralis major mitochondria (H) are shown. All results are shown as means ± SE for n = 6 analyses. Results demonstrate that isolated mitochondria from pectoralis major are viable and are respiration competent. hs-CRP, high-sensitivity C-reactive protein; cTnI, cardiac troponin-I; CK-MB, creatine kinase MB; ECG, electrocardiogram; TUNEL, terminal deoxynucleotidyl transferase-mediated dUTP nick-end labeling.
Fig. 2.
Fig. 2.
Autologous mitochondrial transplantation is not proarrhythmic. A: representative ECG at preischemia, ischemia, and 1, 3, and 120 min following mitochondrial transplantation for leads II and aVF are shown. Millivolts and millisecond scales are shown at right. Time points at which ECGs were obtained are shown at bottom. B: regional ischemia was induced by ligating the left anterior descending artery with a snare. The ischemic zone was identified at 29 min of regional ischemia [shown as gray ellipse in heart (inset)]. C: wet/dry weight ratio between RI-mitochondria and RI-vehicle hearts. D and E: QRS duration (ms; D) and corrected QT interval (E) at preischemia and following 28 days of recovery in RI-vehicle (black bars) and RI-mitochondria (open bars). Results are shown as means ± SE; n = 7–8 for each group. FI: representative sequential isopotential maps from the left ventricles of 3 rat hearts injected with mitochondria are shown. Isopotential maps from 1 cardiac cycle of a representative rat heart are depicted prior to injection (F, far left row), after injection of respiration buffer (G, 2nd row from left), and following mitochondrial transplantation (3.4 ± 1.7 × 10⁹ mitochondria; H, middle row). The color scale from blue to red represents a change in the membrane potential from hyperpolarization to depolarization. I: 2nd row from right shows the corresponding phase of the cardiac cycle for each column on a simultaneously recorded electrogram at the transition point between red and black.
Fig. 3.
Fig. 3.
Autologous mitochondrial transplantation ameliorates myocardial injury and enhances regional function. A: representative photograph of RI-vehicle and RI-mitochondria hearts stained with 1% triphenyltetrazolium chloride (TTC) after 28 days of recovery. White areas show myocardial necrosis. Brick red areas show viable tissue. Scale in mm is shown. B: area at risk, the area subjected to regional ischemia and infarct size as determined by TTC staining in RI-mitochondria and RI-vehicle hearts after 2 h of recovery and after 28 days of recovery. Results are shown as means ± SE; n = 7–8 for each group. **Statistical differences at P < 0.05 vs. RI-vehicle. C and D: representative 2-dimensional (2D) short-axis images of left ventricular diastole and systole at the midportion of the left ventricle are shown for RI-vehicle (C) and RI-mitochondria (D) hearts following 28 days of recovery. ECG wave forms are shown in green at the bottom of each image. The arrows in C indicate regional hypokinesis within the ischemic zone in RI-vehicle heart. Comparative M-mode is indicated with arrows. Hypokinesis was not observed in RI-mitochondria hearts. Representative transthoracic 2D short-axis videos are provided as Supplemental Videos S1 and S2 (available on the AJP-Heart and Circulatory Physiology web site). E and F: CK-MB (ng/ml; E) and cTnI (ng/ml; F) were measured serially on days 1 and 3 following myocardial ischemia in serum from RI-vehicle (black bars) and RI-mitochondria hearts (open bars). Results are shown as means ± SE; n = 7–8 for each group. **Statistical differences at P < 0.05 vs. RI-vehicle. G: total tissue ATP content (μmol/g dry weight) in the area at risk of RI-vehicle and RI-mitochondria hearts at 21 days of recovery. All results are shown as means ± SE; n = 4 for each group. **Significant differences at P < 0.05 vs. RI-vehicle. H and I: TUNEL (positive cell nuclei/1,000 cells; H) and caspase-3 activity (active units: pmol DVED-pNA·μg−1·min−1; I) in RI-vehicle and RI-mitochondria at 28 days of recovery are shown. Results are shown as means ± SE; n = 7–8 for each group. **Statistical differences at P < 0.05 vs. RI-vehicle.
Fig. 4.
Fig. 4.
Mitochondrial transplantation and apoptosis activation. The human apoptosis 3-plex assay was performed. Standard curves were run in duplicate. Both intact mitochondria and mitochondrial fragments (sonicated mitochondria) were investigated separately for activation of caspase-3 and poly-ADP-ribose polymerase (PARP) cleavage in HeLa cells following 48-h coculture. GAPDH was used for control. Concentrations are shown in pg/ml. There was no significant difference (P < 0.05) vs. control. All samples were run and assayed in triplicate. NS, not significant.
Fig. 5.
Fig. 5.
Localization and uptake of transplanted mitochondria in the rabbit heart. A: control heart left ventricular tissue stained for anti-α-actinin 2 (ACTN2; green) and nuclei (blue; left); RI-mitochondria tissue from the area at risk injected with autologous mitochondria prelabeled prior to injection with MTRed (red) at 2 (left middle), 8 (right middle), and 24 h of recovery (far right). Arrows indicate transplanted mitochondria. B: MTRed CMXRos-labeled autologous mitochondria injected into the area at risk in the in vivo rabbit heart for 4 h. After fixation and sectioning, the tissue was labeled for nuclei [4′,6-diamidino-2-phenylindole (DAPI) shown in blue] and the organelle-specific MitoFluor Green (shown in green) to show the injected mitochondria and in situ mitochondria. The merged image at the right shows the injected autologous mitochondria as yellow (merged red and green). C: RI-mitochondria tissue from the area at risk injected with HeLa cell mitochondria after 8 h of recovery. Hela cell mitochondria were detected using the anti-human mitochondrial antibody (MTC02) and Alexa 488 anti-mouse antibody (green). Myocytes are shown with dystrophin polyclonal antibody (CAP 6–10) detected with Alexa 568 anti-rabbit antibody (shown in red). Nuclei are shown using DAPI (blue). Images left to right show that the majority of transplanted mitochondria remained in the interstitial spaces; however, numerous injected mitochondria did appear to reside within cardiomyocytes. Arrows indicate transplanted mitochondria. D: transmission electron micrographs of RI-vehicle (low and high magnifications on left) and RI-mitochondria tissue from the area at risk injected with autologous mitochondria (right middle and right). C, collagen; M, transplanted mitochondria; N, nuclei; S, sarcomere. Scale bars are 25 and 5 μm in length for fluorescent and electron micrographs, respectively. E: transplanted autologously derived mitochondria were observed in close proximity to cardiomyocytes and internalized in both cardiomyocytes and noncardiomyocytes (arrows). Rabbit heart myocardial cell nuclei stained with DAPI are shown at left, and α-actinin 2 (green) is shown at left middle. Autologously derived mitochondria labeled with MTRed are shown at right middle. The merged images are shown at left. Scale bars, 25 μm.
Fig. 6.
Fig. 6.
Transplantation of autologous mitochondria in rat neonatal cardiomyocytes and high-energy synthesis. A: neonatal rat cardiomyocytes incubated for 24 h with Lewis rat liver mitochondria labeled with MTRed. Nuclei (DAPI, blue; left), F-actin (green; left middle), Lewis rat liver mitochondria (red; right middle), and the merged image (right). Scale bars, 25 μm. B: cardiomyocytes stained for total mitochondria with MitoFluor Red and DNA with DAPI (blue). Control cardiomyocytes (left) and cardiomyocytes cocultured with HeLa cell mitochondria detected with anti-human MTC02 and Alexa 488 anti-mouse antibody (green) for 2 (left middle), 8 (right middle), and 24 h (right). The 2-h time period shows that many mitochondria are extracellular, whereas the 8-h time period shows that most mitochondria are internalized in the cardiomyocytes. The 24-h time period shows a mixture of intra- and extracellular mitochondria. Scale bars, 25 μm. C: cardiomyocytes cocultured with HeLa mitochondria detected using MTC02 and Alexa 488 anti-mouse antibody (green) and CM-DiI for 4 h to reveal the cell membranes. Nuclei are stained blue. Scale bars are 25 μm. D: transmission electron microscopy of syngeneic rat liver mitochondria inside cardiomyocytes in plastic section is shown at left. To detect xenogenic HeLa mitochondria in cardiomyocytes, frozen sections were incubated with anti-human MTC02, which was detected with an anti-mouse secondary antibody and a protein A-gold conjugate (shown as black dots, indicated by white arrows at middle and right). Transplanted mitochondria range in size from 500 to 1,200 nm in diameter. Scale bars, 500 nm. m, Native mitochondria. Arrows represent transplanted mitochondria. E: oxygen consumption rate (OCR) and rate of acid efflux (ECAR) in day 2 neonatal rat cardiomyocytes in control, cocultured with respiration media only (Con), and in cardiomyocytes cocultured with respiration media containing 1.26 × 10⁶ rat liver mitochondria at 2, 4, or 8 h following coculture. Results are means ± SE; n = 4–8 each. *P < 0.05 vs. control. F: costaining with the acidotropic probe LysoTracker (shown in red). G: costaining with the lysosomal protein LAMP-1 (shown in red). H and I (higher magnification): costaining with cadaverine (autophagosome; shown in red). Scale bars, 500 nm. There was no colocalization of mitochondria with any of the lysosomal or autophagosomal markers.
Fig. 7.
Fig. 7.
Autologous mitochondrial transplantation: immune and autoimmune responses. AC: serum immune markers of inflammation were determined serially. Control samples were obtained in preischemia. IL-6 (A), hs-CRP (B), and TNFα (C) in RI-mitochondria and RI-vehicle. Time points in days are noted. hs-CRP was within the normal range for both RI-vehicle and RI-mitochondrial hearts at each time point. All results are shown as means ± SE; n = 7–8 for each group at each time point. *Statistical differences at P < 0.05 vs. control; **statistical differences at P < 0.05 vs. RI-vehicle. D: autoimmune response to mitochondrial transplantation was determined at 28 days of recovery. Both RI-mitochondria and RI-vehicle are shown. Serum dilution was 1:40 for each sample. The Left images show Hep-2 cells stained with DAPI (blue). Left middle images show Hep-2 cell mitochondria stained with human serum from a patient with primary biliary cirrhosis, which contained a high titer of anti-mitochondrial antibody (AMA), and FITC-conjugated donkey anti-human IgG antisera. Right middle images show rabbit serum to AMA and rhodamine-conjugated donkey anti-rabbit IgG antisera. No reaction in RI-mitochondria samples is shown. In RI-vehicle, a nonspecific IgG reaction was observed, but it was not AMA. Merged images are at right. Scale bars, 25 μm. Animal no. is n = 4 for each group. E: mitochondrial transplantation and cytokine and chemokine activation. Multiplex (42-plex) analysis of cytokines and chemokines using the Human Cytokine 42-plex Discovery Assay was performed. Standard curves were run in duplicate. Both intact mitochondria and mitochondrial fragments (sonicated mitochondria) were investigated separately for chemokine and cytokine activation in human peripheral blood mononuclear cells following 24 h. Concentration for each cytokine (pg/ml) is shown in log scale. Significantly increased cytokines compared with vehicle (P < 0.05) are indicated with arrows. Epidermal growth factor (EGF), growth-related oncogene (GRO), IL-6, and monocyte chemotactic protein-3 (MCP-3) were elevated in both intact HeLa mitochondria and sonicated HeLa mitochondria. All samples were run in triplicate and assayed in triplicate.
Fig. 8.
Fig. 8.
Transplantation of autologous mitochondria increases differentially expressed proteins. AD: proteomic quality control analysis. A: box plot analysis shows alignment of average iTRAQ intensity values for control (controls 1 and 2), RI-vehicle (RI-vehicle 2 and 3), and RI-mitochondria (RI-mitochondria 1–3). B: dendrogram of proteomic comparisons. C: pairwise correlation plots show highly significant differences in expressed proteins. D: principal component analysis for proteins detected in control (green), RI-vehicle (red), and RI-mitochondria (blue). PC1, principal component 1; PC2, principal component 2. E: Venn diagram for control (green), RI-vehicle (red), and RI-mitochondria (blue). A total of 76 high-confidence proteins were identified as trending toward differential expression. The number of uniquely expressed proteins for each treatment is indicated. F: hierarchical cluster analysis of RI-mitochondria and RI-vehicle. All results are compared with control to account for constitutive protein expression levels. Samples include 2 controls, 2 RI-vehicle, and 3 RI-mitochondria. The differentially expressed proteins were identified by supervised analysis on the basis of P < 0.01 in each group. The log fold change (FC) in protein expression is shown with pseudocolor scale (−3 to 3), with red denoting upregulation and green denoting downregulation. Columns represent FC comparisons, and rows represent the proteins. Dendrograms are found on the left side, and experimental groups are found on the bottom. CTR1 and -2, controls 1 and 2; RI2 and -3, RI-vehicle 2 and 3; MITO1–3, RI-mitochondria 1–3.

Similar articles

Cited by

References

    1. Black KM, Barnett RJ, Bhasin MK, Daly C, Dillon ST, Libermann TA, Levitsky S, McCully JD. Microarray and proteomic analysis of the cardioprotective effects of cold blood cardioplegia in the mature and aged male and female. Physiol Genomics 44: 1027–1041, 2012 - PMC - PubMed
    1. Bloch DB, Yu JH, Yang WH, Graeme-Cook F, Lindor KD, Viswanathan A, Bloch KD, Nakajima A. The cytoplasmic dot staining pattern is detected in a subgroup of patients with primary biliary cirrhosis. J Rheumatol 32: 477–483, 2005 - PubMed
    1. Byers TJ, Kunkel LM, Watkins SC. The subcellular distribution of dystrophin in mouse skeletal, cardiac, and smooth muscle. J Cell Biol 115: 411–421, 1991 - PMC - PubMed
    1. Chan Y, Tong HQ, Beggs AH, Kunkel LM. Human skeletal muscle-specific alpha-actinin-2 and -3 isoforms form homodimers and heterodimers in vitro and in vivo. Biochem Biophys Res Commun 248: 134–139, 1998 - PubMed
    1. Chen Q, Moghaddas S, Hoppel CL, Lesnefsky EJ. Reversible blockade of electron transport during ischemia protects mitochondria and decreases myocardial injury following reperfusion. J Pharmacol Exp Ther 319: 1405–1412, 2006 - PubMed

Publication types