. 2013 Apr 1;304(7):L481-8.
doi: 10.1152/ajplung.00343.2012. Epub 2013 Jan 25.

Compromised respiratory function in lethal influenza infection is characterized by the depletion of type I alveolar epithelial cells beyond threshold levels

Affiliations

Compromised respiratory function in lethal influenza infection is characterized by the depletion of type I alveolar epithelial cells beyond threshold levels

Catherine J Sanders et al. Am J Physiol Lung Cell Mol Physiol. .

Abstract

During influenza virus infection, it is unclear how much alveolar cell loss can be tolerated before the host succumbs to the disease. We sought to define relevant correlates of disease severity in the mouse influenza model, hypothesizing that a susceptibility threshold exists for alveolar epithelial cell loss. We compared lung pathology, virus spread, alveolar epithelial cell depletion, arterial blood oxygenation, physiological responses measured by unrestrained plethysmography, and oxygen consumption and carbon dioxide production by gas analysis in mice at intervals after infection with virus strains and doses that cause mild (x31) or severe (PR/8) influenza. Both mild and severe infections showed similar degrees of lung damage and virus dissemination until day 6 after inoculation but diverged in survival outcomes from day 9. Day 6 PR/8-infected mice had normal respiratory and gas exchange functions with 10% type I cell loss. However, day 10 PR/8-infected mice had 40% type I cell loss with a concomitant drastic decreases in tidal and minute volumes, Vo(2), Vco(2), and arterial blood oxygenation, compared with a maximum 3% type I cell loss for x31 on day 10 when they recovered body weight and respiratory functions. Alterations in breaths per minute, expiratory time, and metabolic rate were observed in both infections. A threshold for maintenance of proper respiratory function appears to be crossed once 10% of alveolar type I cells are lost. These data indicate that lethality in influenza virus infection is a matter of degree rather than quality.


Figures
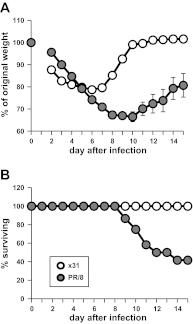
Fig. 1.
Fig. 1.
Comparison of weight loss and necessary euthanasia in PR/8- vs. x31-infected mice after infection. A: weight loss as a percentage of original weight. B: percent mice not reaching guidelines for euthanasia (severely moribund). x31, n = 27; PR/8, n = 16 mice. Means ± SE shown.
Fig. 2.
Fig. 2.
PR/8-infected mice have more severe respiratory functions than x31-infected mice. Respiratory functions of mice days 2–15 after infection. A: box flow waveform of uninfected vs. day (d) 9 postinfection mice; 0.8 s acquisition (ml/s). B: breaths per minute. C: tidal volume (ml). D: minute volume (ml/min). E: expiratory time (s). Four to 6 mice per time point until d13. d13–15 PR/8, n = 2; x31, n = 3. SE shown. *P < 0.05, **P < 0.005, ***P < 0.0005. Asterisks by bars: significance between uninfected (uninf.) and specified group on that day. Significance between x31 and PR/8 groups on specific days (not shown on graph): breaths per minute (B) d2 P < 0.0005, d12 P < 0.05; tidal volume (C) d2 P < 0.005, d6 P < 0.05; d7, d8, d9 P < 0.005; d10, d11 P < 0.0005; d12 P < 0.05; minute volume (D) d5 P < 0.05, d6 P < 0.005; d7 P < 0.05; d8 P < 0.005; d9 P < 0.05; d10, d11, d12 P < 0.0005; d13 P < 0.005; d14 P < 0.05; expiratory time (E) d2 P < 0.0005, d3, d4, d11 P < 0.05.
Fig. 3.
Fig. 3.
Comparison of arterial blood oxygen and carbon dioxide in PR/8- vs. x31-infected mice up to 30 days. A: partial pressure of arterial blood oxygen (ppO2) (mmHg). B: partial pressure arterial blood carbon dioxide (ppCO2). C: percent oxygen saturation (sat.) in arterial blood was determined by clinical diagnostics. x31, n = 3–6 mice/time point; PR/8, n = 3–8 mice/time point. Means ± SE shown. *P < 0.05, **P < 0.005, ***P < 0.0005. Asterisks by bars: significance between uninfected (un.) and specified group on that day. Significance between x31 and PR/8 groups on specific days (not shown on graph): ppO2 d9 P < 0.05, d12 P < 0.0005, d15 P < 0.05, d20 P < 0.005.
Fig. 4.
Fig. 4.
PR/8-infected mice consumed less oxygen and produced less carbon dioxide during times of peak illness. Gas exchange functions of BL/6 mice days 2–15 after infection with either x31 or PR/8. A: volume oxygen consumed (V̇o2). B: volume carbon dioxide produced (V̇co2). C: metabolic rate (MR). V̇o2, V̇co2 units are ml/min; 4–6 mice per time point up to d12. d13–15 PR/8, n = 2; x31, n = 3. SE shown. *P < 0.05, **P < 0.005, ***P < 0.0005. Asterisks by bars: significance between uninfected and specified group on that day. Significance between x31 and PR/8 groups on specific days (not shown on graph): V̇o2 (A) d2 P < 0.005; d3, d6, d7 P < 0.05; d8, d9, d10, d11 P < 0.005; d12 P < 0.05; V̇co2 (B) d2 P < 0.005; d3 P < 0.05; d6, d7, d8 P < 0.005; d9 P < 0.05; d10, d11, d12 P < 0.005; MR (C) d2 P < 0.005; d3 P < 0.05; d6 P < 0.05; d8, d9 P < 0.005; d10 P < 0.0005; d11 P < 0.005; d12 P < 0.05.
Fig. 5.
Fig. 5.
Histological damage of lung tissues from mice infected with x31 or PR/8. Whole lung tissue removed from 3 (uninfected; u.) or 6 (infected) mice on noted days after infection (x-axis) were stained with hematoxylin and eosin. A pathologist scored tissues on a 1–5 scale for severity of bronchiolitis (A), peribronchiolitis (B), pervasculitis (C), alveolitis (D), and interstitial pneumonitis (E). Means ± SE shown. *P < 0.05, **P < 0.005, ***<0.0005. Asterisks by bars: significance between uninfected and specified group on that day. Significance between x31 and PR/8 groups on specific days (not shown on graph): alveolitis (A) d12 P < 0.05; d15, d20, d30 P < 0.0005; bronchiolitis (B) d3 P < 0.05; perivasculitis (C) d15 P < 0.05, d20 P < 0.0005, d30 P < 0.05; peribronchiolitis (D) d9 P < 0.0005, d15 P < 0.005, d20 P < 0.0005; interstitial pneumonitis (E) d6 P < 0.05, d12 P < 0.005, d15 P < 0.05, d20 P < 0.005, d30 P < 0.0005.
Fig. 6.
Fig. 6.
Viral presence in lung tissues from mice infected with x31 or PR/8 over time. Whole lung tissue removed from mice on noted days after infection was stained for influenza A (A and B) or analyzed for plaque-forming units (PFU) on MDCK cell monolayers (C). A pathologist blindly scored tissues on a 1–5 scale for influenza A presence in bronchioles (A) and alveoli (B). C: PFU of 3 lungs per treatment group per day, calculated from plaque counts. Means ± SE. *P < 0.05.
Fig. 7.
Fig. 7.
Increased depletion of type I and type II alveolar epithelial cells (AEC) in PR/8-infected vs. x31-infected mice. Whole lung tissue from uninfected or d10 postinfection mice were stained with podoplanin (type I AEC) or surfactant C (type II AEC). Representative images of uninfected mouse lung podoplanin staining (A), uninfected mouse lung surfactant C staining (B), d10 podoplanin staining in x31-infected mouse lungs (C), d10 surfactant C staining in x31-infected mouse lungs (D), d10 podoplanin staining in PR/8-infected mouse lungs (E), and d10 surfactant C staining in PR/8-infected mouse lungs (F). Whole lungs from mice d10 after PR/8 (G) or x31 (H) infection were removed, sectioned, and stained for podoplanin. Representative whole lobe section shown.

Similar articles

Cited by

  • A comprehensive collection of systems biology data characterizing the host response to viral infection.
    Aevermann BD, Pickett BE, Kumar S, Klem EB, Agnihothram S, Askovich PS, Bankhead A 3rd, Bolles M, Carter V, Chang J, Clauss TR, Dash P, Diercks AH, Eisfeld AJ, Ellis A, Fan S, Ferris MT, Gralinski LE, Green RR, Gritsenko MA, Hatta M, Heegel RA, Jacobs JM, Jeng S, Josset L, Kaiser SM, Kelly S, Law GL, Li C, Li J, Long C, Luna ML, Matzke M, McDermott J, Menachery V, Metz TO, Mitchell H, Monroe ME, Navarro G, Neumann G, Podyminogin RL, Purvine SO, Rosenberger CM, Sanders CJ, Schepmoes AA, Shukla AK, Sims A, Sova P, Tam VC, Tchitchek N, Thomas PG, Tilton SC, Totura A, Wang J, Webb-Robertson BJ, Wen J, Weiss JM, Yang F, Yount B, Zhang Q, McWeeney S, Smith RD, Waters KM, Kawaoka Y, Baric R, Aderem A, Katze MG, Scheuermann RH. Aevermann BD, et al. Sci Data. 2014 Oct 14;1:140033. doi: 10.1038/sdata.2014.33. eCollection 2014. Sci Data. 2014. PMID: 25977790 Free PMC article.
  • Direct IL-6 Signals Maximize Protective Secondary CD4 T Cell Responses against Influenza.
    Strutt TM, McKinstry KK, Kuang Y, Finn CM, Hwang JH, Dhume K, Sell S, Swain SL. Strutt TM, et al. J Immunol. 2016 Oct 15;197(8):3260-3270. doi: 10.4049/jimmunol.1600033. Epub 2016 Sep 19. J Immunol. 2016. PMID: 27647834 Free PMC article.
  • Influenza lung injury: mechanisms and therapeutic opportunities.
    Gregory DJ, Kobzik L. Gregory DJ, et al. Am J Physiol Lung Cell Mol Physiol. 2015 Nov 15;309(10):L1041-6. doi: 10.1152/ajplung.00283.2015. Epub 2015 Sep 25. Am J Physiol Lung Cell Mol Physiol. 2015. PMID: 26408556 Free PMC article. Review.
  • The Mechanism behind Influenza Virus Cytokine Storm.
    Gu Y, Zuo X, Zhang S, Ouyang Z, Jiang S, Wang F, Wang G. Gu Y, et al. Viruses. 2021 Jul 14;13(7):1362. doi: 10.3390/v13071362. Viruses. 2021. PMID: 34372568 Free PMC article. Review.
  • A mouse model for MERS coronavirus-induced acute respiratory distress syndrome.
    Cockrell AS, Yount BL, Scobey T, Jensen K, Douglas M, Beall A, Tang XC, Marasco WA, Heise MT, Baric RS. Cockrell AS, et al. Nat Microbiol. 2016 Nov 28;2(2):16226. doi: 10.1038/nmicrobiol.2016.226. Nat Microbiol. 2016. PMID: 27892925 Free PMC article.

References

    1. Abdul-Careem MF, Mian MF, Yue G, Gillgrass A, Chenoweth MJ, Barra NG, Chew MV, Chan T, Al-Garawi AA, Jordana M, Ashkar AA. Critical role of natural killer cells in lung immunopathology during influenza infection in mice. J Infect Dis 206: 167–177, 2012 - PubMed
    1. Bates J, Irvin C, Brusasco V, Drazen J, Fredberg J, Loring S, Eidelman D, Ludwig M, Macklem P, Martin J, Milic-Emili J, Hantos Z, Hyatt R, Lai-Fook S, Leff A, Solway J, Lutchen K, Suki B, Mitzner W, Pare P, Pride N, Sly P. The use and misuse of Penh in animal models of lung disease. Am J Respir Cell Mol Biol 31: 373–374, 2004 - PubMed
    1. Bruder D, Srikiatkhachorn A, Enelow RI. Cellular immunity and lung injury in respiratory virus infection. Viral Immunol 19: 147–155, 2006 - PubMed
    1. Chan MC, Chan RW, Yu WC, Ho CC, Chui WH, Lo CK, Yuen KM, Guan YI, Nicholls JM, Peiris JS. Influenza H5N1 virus infection of polarized human alveolar epithelial cells and lung microvascular endothelial cells. Respir Res 10: 102, 2009 - PMC - PubMed
    1. Chan MC, Cheung CY, Chui WH, Tsao SW, Nicholls JM, Chan YO, Chan RW, Long HT, Poon LL, Guan Y, Peiris JS. Proinflammatory cytokine responses induced by influenza A (H5N1) viruses in primary human alveolar and bronchial epithelial cells. Respir Res 6: 135, 2005 - PMC - PubMed

Publication types