. 2013 Mar 15;288(11):7815-7828.
doi: 10.1074/jbc.M112.417196. Epub 2013 Jan 25.

The effect of including the C2 insert of nonmuscle myosin II-C on neuritogenesis

Affiliations

The effect of including the C2 insert of nonmuscle myosin II-C on neuritogenesis

Shekhar Saha et al. J Biol Chem. .

Abstract

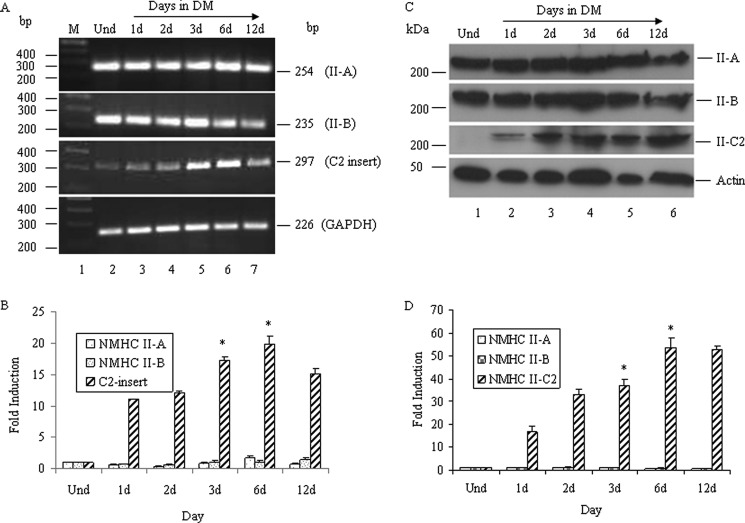
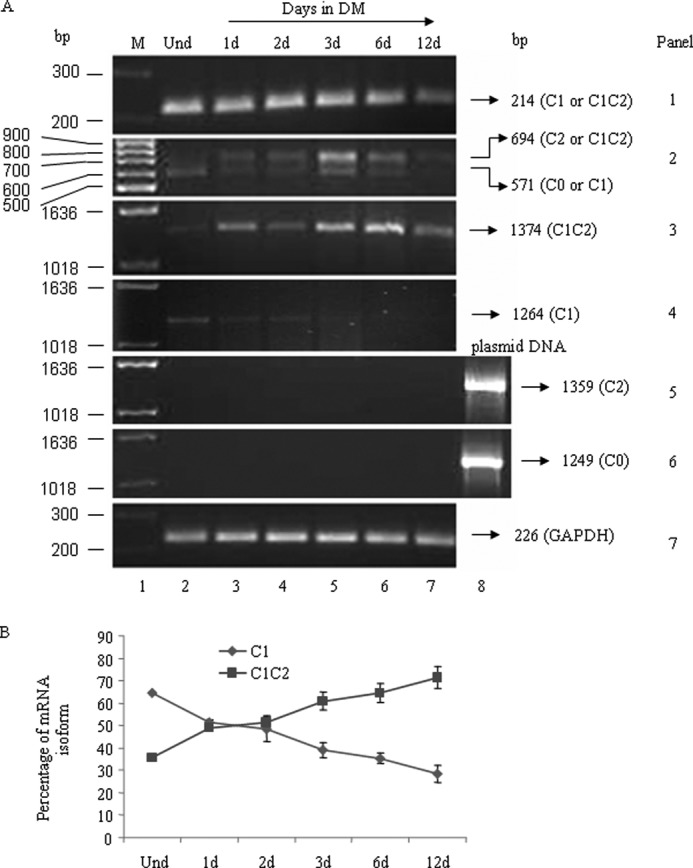
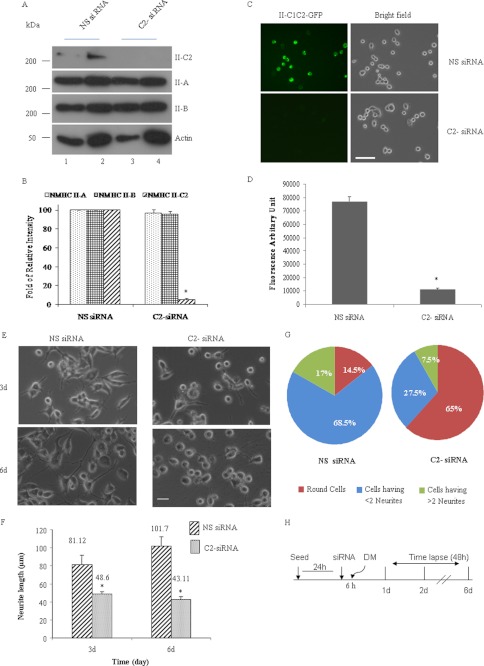
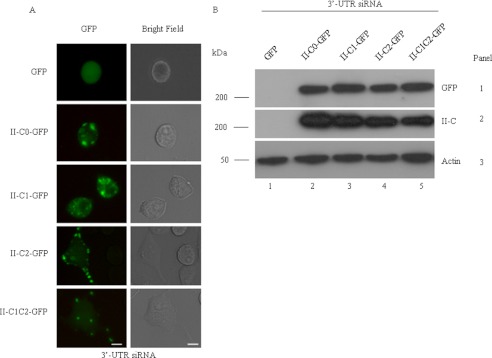
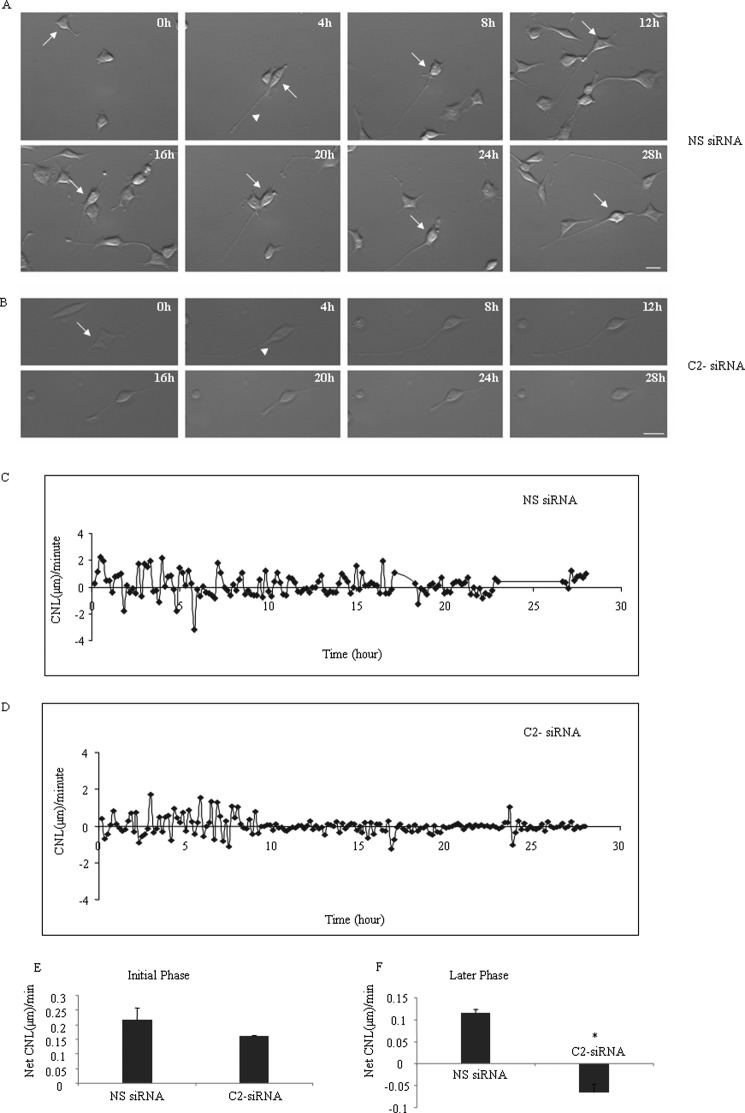
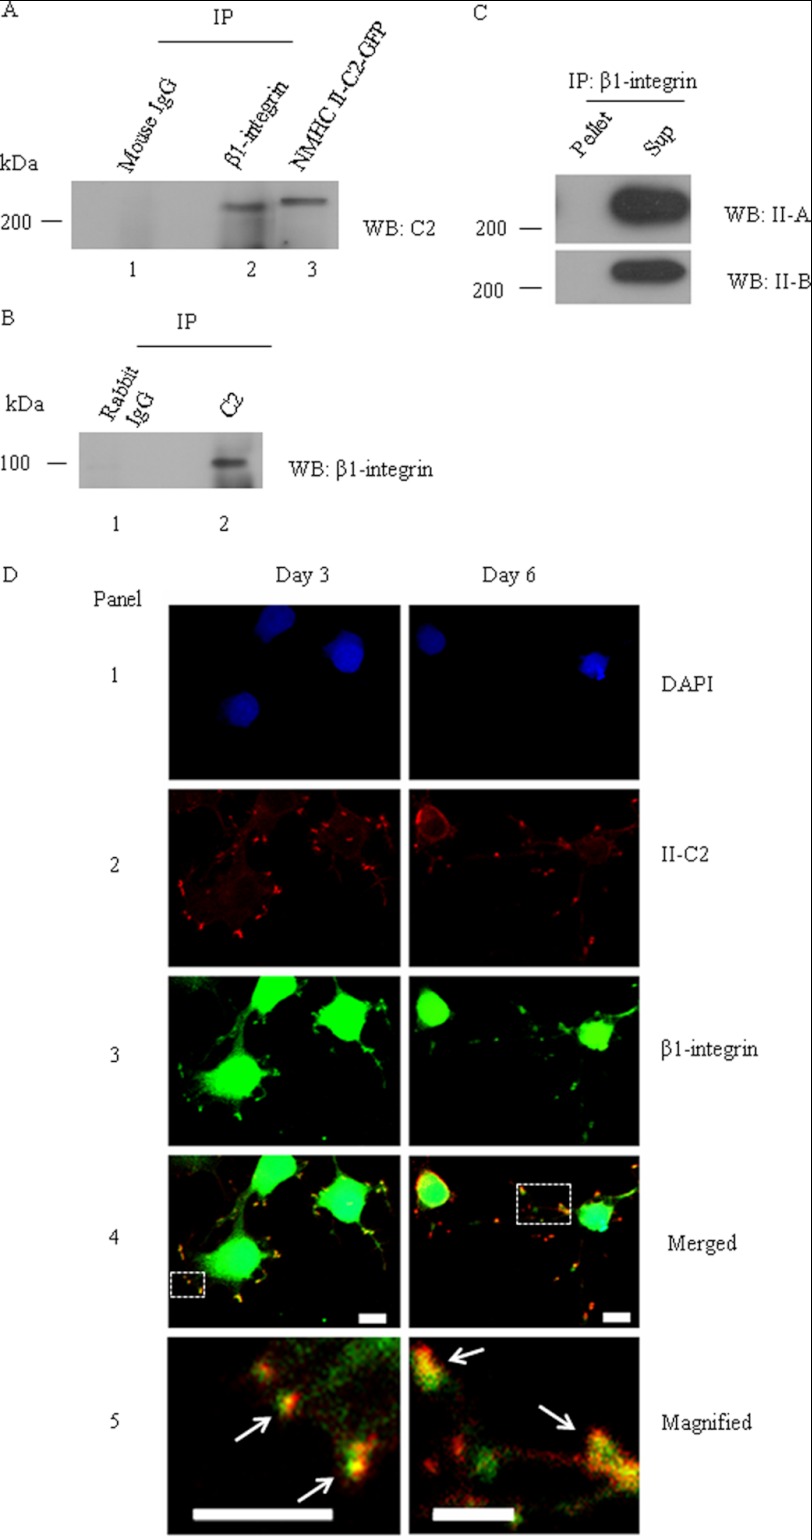
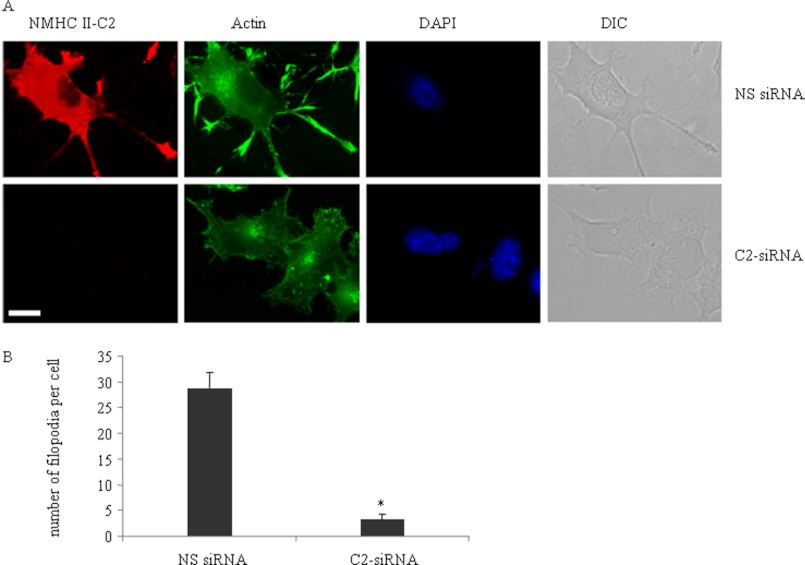
The functional role of the C2 insert of nonmuscle myosin II-C (NM II-C) is poorly understood. Here, we report for the first time that the expression of the C2 insert-containing isoform, NM II-C1C2, is inducible in Neuro-2a cells during differentiation both at mRNA and protein levels. Immunoblot and RT-PCR analysis reveal that expression of NM II-C1C2 peaks between days 3 and 6 of differentiation. Localization of NM II-C1C2 in Neuro-2a cells suggests that the C2 insert-containing isoform is localized in the cytosol and along the neurites, specifically at the adherence point to substratum. Inhibition of endogenous NM II-C1C2 using siRNA decreases the neurite length by 43% compared with control cells treated with nonspecific siRNA. Time lapse image analysis reveals that neurites of C2-siRNA-treated cells have a net negative change in neurite length per minute, leading to a reduction of overall neurite length. During neuritogenesis, NM II-C1C2 can interact and colocalize with β1-integrin in neurites. Altogether, these studies indicate that NM II-C1C2 may be involved in stabilizing neurites by maintaining their structure at adhesion sites.


Figures

FIGURE 1.
FIGURE 1.
Expression of NMHC II-C2 is induced during differentiation. Total RNA from undifferentiated and differentiated Neuro-2a cells at the indicated time was subjected to RT-PCR analysis for NMHC II isoforms using primers specific for each isoform. A, expression of the NMHC IIs, as indicated. GAPDH was used as a control for cDNA in the PCR. B, quantification of NMHC II-A, NMHC II-B, and C2 insert-containing NMHC II-C mRNA, which was done by quantitative real-time PCR, and -fold induction during differentiation compared with undifferentiated cells (Und) was calculated using the equation, -fold induction = 2−ΔΔCt, where Ct represents the threshold cycle number for a gene. C, cell lysates from differentiated Neuro-2a cells at the indicated times were subjected to immunoblot using anti-C2 insert, NMHC II-A, NMHC II-B, and actin antibodies. Note that the expression of the C2 insert-containing isoform increased with the differentiation, whereas that of II-A and II-B remained unchanged. Actin was used as a loading control. Results show representative blots from a total of three experiments. Quantification of C2 insert-containing NMHC II-Cs and NMHC II-A/II-B expression is shown in D, considering band intensity of the immunoblot in undifferentiated cells as 1. Results are expressed as mean ± S.E. (error bars) from three independent experiments. *, p < 0.05 for undifferentiated versus 3/6-day differentiated cells. d, days.
FIGURE 2.
FIGURE 2.
Quantification of NMHC II-C mRNA isoforms. Total RNA from undifferentiated (lane 2) and differentiated Neuro-2a cells at the indicated time (after the addition of DM, lanes 3–7) was subjected to RT-PCR analysis for NMHC II-C isoforms using primers specific for each NMHC II-C isoform. The panels in A show the expression of each isoform of NMHC II-C, as indicated in a representative gel. GAPDH was used as a control for cDNA in the PCR. Plasmid DNA encoding NMHC II-C0 or NMHC II-C2 (lane 8) was used as positive control for PCR in panels 5 and 6. Note that C1 and C1C2 mRNA are the major isoforms expressed in 3–6-day-differentiated Neuro-2a cells. B, quantification of C1 and C1C2 mRNA was expressed as a percentage of total NMHC II-C mRNA (see panel 2 in A). Percentage of an isoform = (intensity of band corresponding to an isoform/total intensity of two bands generated using C2 flanking primers) × 100. Band intensity was measured using ImageJ software. Note that the NMHC II-C1C2 population was increased with differentiation, whereas that of NMHC II-C1 decreased. Results are expressed as mean ± S.E. (error bars) from three independent experiments. d, days.
FIGURE 3.
FIGURE 3.
Inhibition of NM II-C1C2 isoform expression interferes with neuritogenesis. A, immunoblots of two different amounts of Neuro-2a cell lysates with the indicated antibodies. Note that C2-siRNA specifically inhibited NMHC II-C1C2 expression but not NMHC II-A or NMHC II-B expression. Cell lysates were prepared at 72 h after siRNA transfection. B, -fold inhibition by siRNA treatment was calculated by measuring band intensity using ImageJ software and considering the band intensity of NMHC II-C1C2 in nonspecific siRNA-treated cells as 1. C, microscopy images of Neuro-2a cells transfected with GFP-tagged NMHC II-C1C2 and nonspecific siRNA or C2-siRNA. Top left panel, green fluorescence signal coming from NMHC II-C1C2-GFP in nonspecific siRNA-treated cells; bottom left panel, inhibition of fluorescence intensity in C2-siRNA-treated cells. Their corresponding bright field images are shown in the right panels. -Fold inhibition in fluorescence intensity was calculated using NIS-D software and is shown in D. E, bright field images of nonspecific siRNA-treated (left panels) and C2-siRNA-treated (right panels) Neuro-2a cells. Top and bottom panels, 3 and 6 days postdifferentiation, respectively. Neurite length was measured using ImageJ software. Quantification is shown in F. G, pie chart shows that more than 65% cells are round after C2-siRNA treatment. H, schematic representation of time schedule for the addition of siRNA and DM and time lapse microscopy. Scale bar, 100 μm. Results are expressed as mean ± S.E. (error bars) from three independent experiments. *, p < 0.05, nonspecific versus C2-siRNA. d, days.
FIGURE 4.
FIGURE 4.
Rescuing the siRNA-induced decrease in neurite length using GFP NMHC II-Cs. A, GFP-tagged NMHC II constructs were transfected into the NMHC II-C siRNA-treated cells, and the cells were cultured for an additional 72 h in DM. Green fluorescence (left column) and the corresponding bright field (right column) images were captured at 72 h postdifferentiation. B, immunoblot of cell lysates with antibody against GFP (top) and NMHC II-C (middle). Note that the transfection efficiency of each isoform was approximately the same and that siRNA against the 3′-UTR suppresses endogenous expression of NMHC II-C but not exogenous expression. Actin was used as a loading control. Scale bar, 20 μm.
FIGURE 5.
FIGURE 5.
NM II-C1C2-depleted cells show shortening of neurite length. Time lapse images of Neuro-2a cells during differentiation, which were previously treated with nonspecific (A) or C2-siRNA (B). Note that the C2-siRNA-treated cell shows an increase in neurite length, but after 8–10 h of neuritogenesis, the neurite starts having frequent periods of shortening and shows no growth until 28 h of neuritogenesis, whereas control cells treated with nonspecific siRNA show no shortening of neurite length. The arrows indicate the cells that were tracked, and the arrowheads show neurites for which changes of length were measured. C and D, change in neurite length/min over the 28-h period of neuritogenesis of nonspecific siRNA- and C2-siRNA-treated cells. Note that the amplitude value in control neurites is reduced with time, and neurites of C2-siRNA-treated cells show a net average negative value of CNL/min between 8 and 28 h of neuritogenesis. E and F, quantification of net average CNL/min value in nonspecific siRNA- and C2-siRNA treated neurites during initial and later stage of neuritogenesis. Data are represented as means ± S.E. (error bars). *, p < 0.05, not significant (NS) versus C2-siRNA; n > 10 neurites from each treatment; h, hours; scale bar, 10 μm.
FIGURE 6.
FIGURE 6.
Early and later stage of neuritogenesis. A, images of a Neuro-2a cell at 5-min intervals during the early stage of neuritogenesis. The arrowhead indicates the neurite that retracts to the cell body after 10 min. B, images of Neuro-2a cells at the later stage of neuritogenesis, when neurites become axons. The numeric value indicates the number of the neurite, and the arrow indicates the neurite that is an axon. After 20 min of neuritogenesis, neurite 1, which was an axon, becomes a neurite, whereas neurite 2 becomes an axon. Scale bar, 10 μm.
FIGURE 7.
FIGURE 7.
β1-integrin colocalizes and co-precipitates with NM II-C1C2 in differentiated Neuro-2a cells. After 6 days of differentiation, a cell lysate of Neuro-2a cells was used for immunoprecipitation (IP) with β1-integrin or C2 insert-specific antibody. A, immunoprecipitate of β1-integrin antibody was subjected to immunoblot (WB) with C2 insert-specific antibody (lane 2); B, the reverse experiment. Mouse IgG and rabbit IgG were used as negative controls for immunoprecipitation with β1-integrin and C2 insert-specific antibodies, respectively (lane 1). NMHC II-C2-GFP-transfected Neuro-2a cell lysate was used as a positive control for immunoblots with C2 insert-specific antibody (lane 3). C, immunoprecipitate of β1-integrin antibody was subjected to immunoblot with antibodies against NMHC II-A and II-B. Note that both NM II-A and II-B are detectable in the supernatant, not in the pellet. D, colocalization of β1-integrin and NM II-C1C2 in neurites of Neuro-2a cells. Three and 6 days after differentiation, Neuro-2a cells were co-stained for β1-integrin (green, panel 3) and C2 insert (red, panel 2). DAPI was used to stain DNA (blue, panel 1). A merged image is shown in panel 4. The yellow color shown with arrows in panel 5 (magnified image of inset in panel 4) indicates the colocalization of β1-integrin and NM II-C1C2. Scale bar, 10 μm.
FIGURE 8.
FIGURE 8.
Depletion of NM II-C1C2 reduces filopodia frequency in differentiated Neuro-2a cells. A, phalloidin staining to indicate actin localization (green) in nonspecific siRNA-treated (top row) and C2-siRNA-treated (bottom row) Neuro-2a cells after 3 days of differentiation. DAPI (blue) was used to stain nuclei. Note that C2-siRNA reduces the expression of NM II-C1C2 (red) in C2-siRNA-treated cells. B, filopodia frequency in cells transfected with nonspecific and C2-siRNA. Scale bar, 10 μm. *, statistical significance of nonspecific siRNA-treated versus C2-siRNA-treated cells (p < 0.05, n > 25 cells from each group). Error bars, S.E. DIC, differential interference contrast.

References

    1. da Silva J. S., Dotti C. G. (2002) Breaking the neuronal sphere. Regulation of the actin cytoskeleton in neuritogenesis. Nat. Rev. Neurosci. 3, 694–704 - PubMed
    1. Ahmad F. J., Hughey J., Wittmann T., Hyman A., Greaser M., Baas P. W. (2000) Motor proteins regulate force interactions between microtubules and microfilaments in the axon. Nat. Cell Biol. 2, 276–280 - PubMed
    1. Kaether C., Skehel P., Dotti C. G. (2000) Axonal membrane proteins are transported in distinct carriers. A two-color video microscopy study in cultured hippocampal neurons. Mol. Biol. Cell 11, 1213–1224 - PMC - PubMed
    1. Zhou F.-Q., Waterman-Storer C. M., Cohan C. S. (2002) Focal loss of actin bundles causes microtubule redistribution and growth cone turning. J. Cell Biol. 157, 839–849 - PMC - PubMed
    1. He M., Zhang Z.-H., Guan C.-B., Xia D., Yuan X.-B. (2010) Leading tip drives soma translocation via forward F-actin flow during neuronal migration. J. Neurosci. 30, 10885–10898 - PMC - PubMed

Publication types

LinkOut - more resources