. 2013 Mar 22;288(12):8610-8618.
doi: 10.1074/jbc.M112.441535. Epub 2013 Jan 25.

Nuclear envelope composition determines the ability of neutrophil-type cells to passage through micron-scale constrictions

Affiliations

Nuclear envelope composition determines the ability of neutrophil-type cells to passage through micron-scale constrictions

Amy C Rowat et al. J Biol Chem. .

Abstract

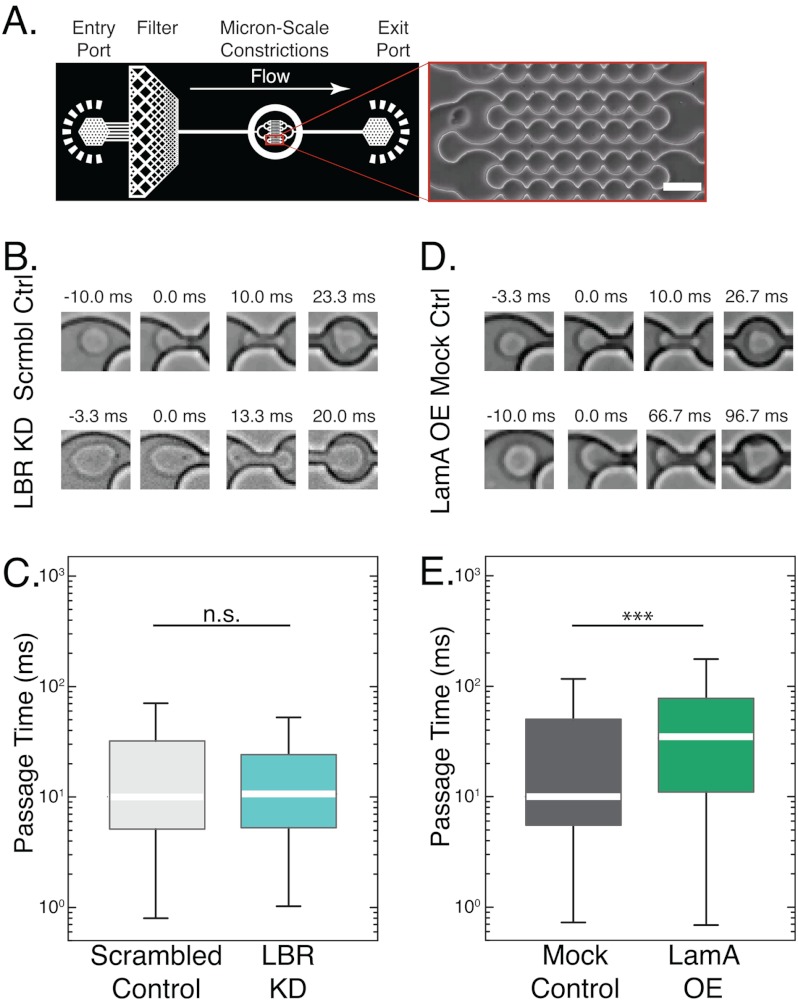
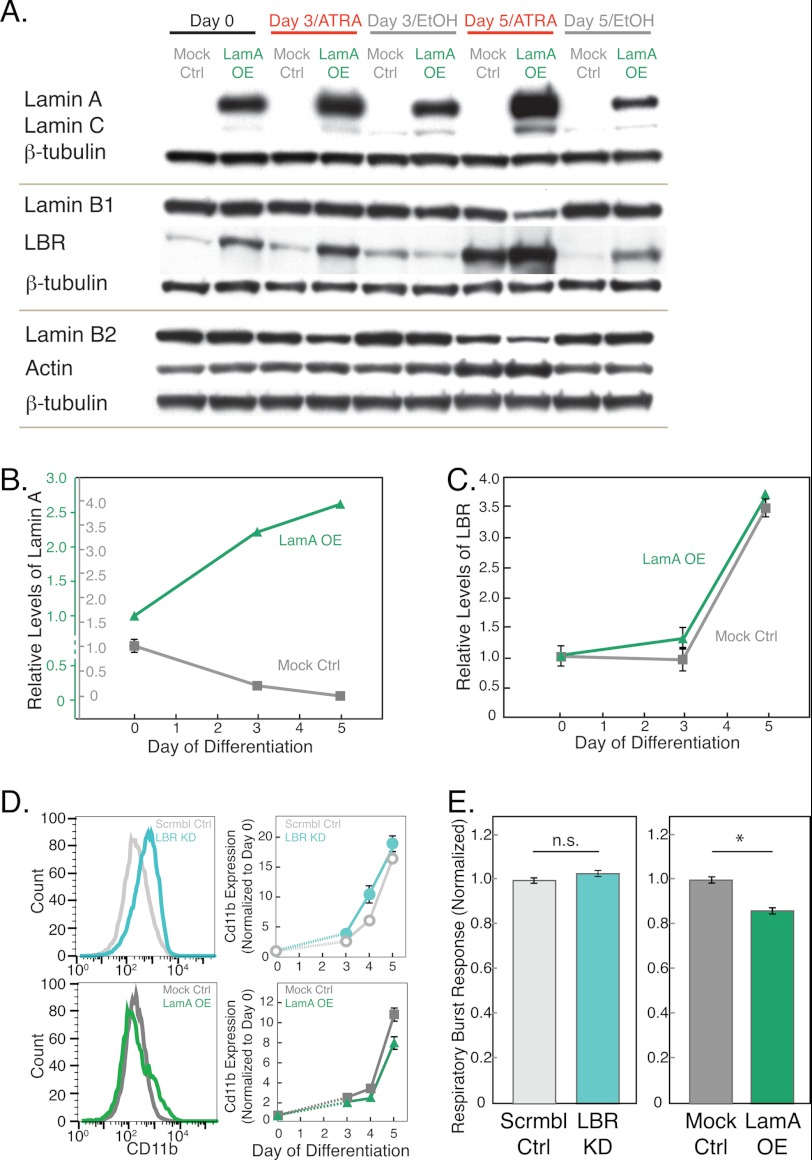
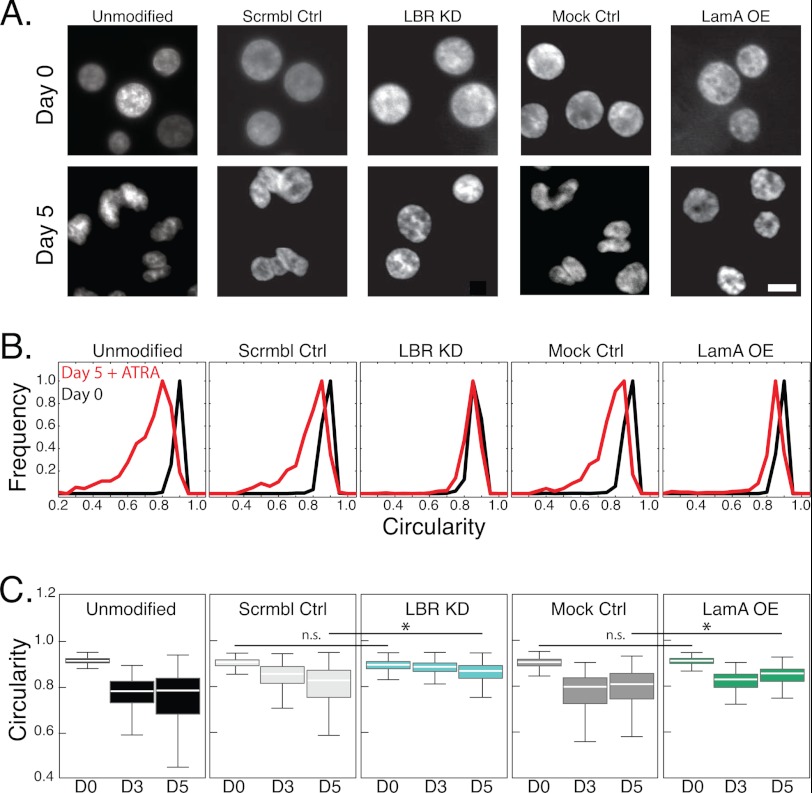
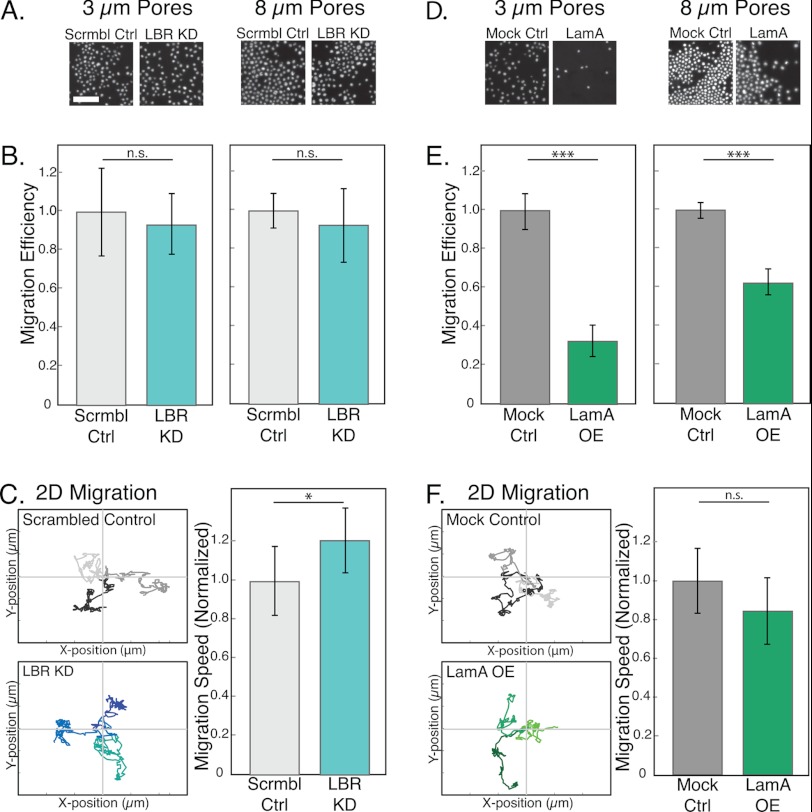
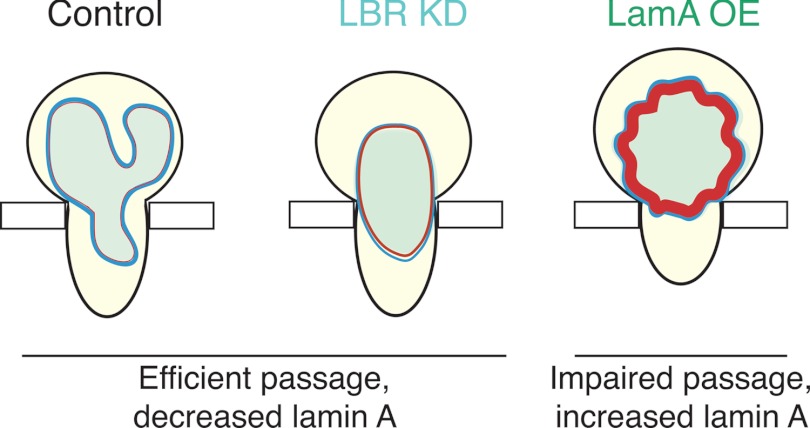
Neutrophils are characterized by their distinct nuclear shape, which is thought to facilitate the transit of these cells through pore spaces less than one-fifth of their diameter. We used human promyelocytic leukemia (HL-60) cells as a model system to investigate the effect of nuclear shape in whole cell deformability. We probed neutrophil-differentiated HL-60 cells lacking expression of lamin B receptor, which fail to develop lobulated nuclei during granulopoiesis and present an in vitro model for Pelger-Huët anomaly; despite the circular morphology of their nuclei, the cells passed through micron-scale constrictions on similar timescales as scrambled controls. We then investigated the unique nuclear envelope composition of neutrophil-differentiated HL-60 cells, which may also impact their deformability; although lamin A is typically down-regulated during granulopoiesis, we genetically modified HL-60 cells to generate a subpopulation of cells with well defined levels of ectopic lamin A. The lamin A-overexpressing neutrophil-type cells showed similar functional characteristics as the mock controls, but they had an impaired ability to pass through micron-scale constrictions. Our results suggest that levels of lamin A have a marked effect on the ability of neutrophils to passage through micron-scale constrictions, whereas the unusual multilobed shape of the neutrophil nucleus is less essential.


Figures

FIGURE 1.
FIGURE 1.
Ectopic expression of lamin A increases passage time through microfluidic constriction channels. A, schematic overview of the microfluidic device and close-up of the 5-μm constrictions. Pressurizing the reservoir drives the cell suspension through the inlet, and cells passage through the channels with 5-μm constrictions, as shown in the inset. Scale bar, 20 μm. B, time-sequence images of day 4/ATRA-treated cells passaging through 5-μm constrictions. Scrmbl Ctrl, scrambled control; Mock Ctrl, mock control. C, LBR KD cells have similar passage times as the scrambled controls despite the round shape of their nucleus, which has been speculated to sterically hinder the passage of cells through narrow pores. D and E, LamA OE cells take longer to passage the constrictions than mock control cells. In all box plots, the white bar denotes the population median, boxes are the 25th and 75th percentiles, and lines show the 10th and 90th percentiles. n.s., p > 0.05 for LBR KD versus scrambled control; ***, p < 0.001 for LamA OE versus mock control. n > 300 cells for each cell type. Error bars represent S.E. over three independent experiments.
FIGURE 2.
FIGURE 2.
Genetically modified HL-60 cells show typical characteristics of neutrophils after ATRA stimulation. A, representative immunoblots for lamins A/C, B1, B2, and LBR with β-tubulin as loading control. Cell lysates are collected from LamA OE and mock control (Mock Ctrl) cells at days 0, 3, and 5 after ATRA stimulation. B and C, quantitative analysis of lamin A and LBR protein levels normalized first to β-tubulin and then to day 0 for each protein in each cell line. Error bars represent S.E. of 3–5 independent experiments; where not visible, they are smaller than the symbols. Based on immunoblot analysis, base-line levels of lamin A are estimated to be ∼20–30× greater in the LamA OE cells as compared with the mock control cells (supplemental Fig. S2); for this reason, two separate axes are plotted for each cell line. D, expression levels of the cell surface antigen, CD11b, a hallmark of neutrophils, increase during differentiation for all cell lines. Left, representative histograms of data from a single flow cytometry experiment showing the distribution of CD11b expression levels at day 4 after ATRA stimulation. Right, graphs showing median values of CD11b after ATRA treatment with the values for each cell line normalized to day 0 for each independent experiment. Error bars represent S.E. over three independent experiments. Scrmbl Ctrl, scrambled control. E, respiratory burst assay that probes superoxide production using a luminescence assay 30 min after stimulation by phorbol myristate acetate, indicating that all cells show normal functional characteristics of neutrophils. Luminescence values are relative to the mock and scrambled control for the left and right panels, respectively. Data represent the average of three independent experiments; error bars represent the S.E. n.s., p > 0.05 for LBR KD versus scrambled control; *, p < 0.05 for LamA OE versus mock control.
FIGURE 3.
FIGURE 3.
Nuclear shape transition during granulopoiesis requires lamin A down-regulation and LBR up-regulation. A, fluorescent images of Hoechst-stained nuclei acquired at day 0 and day 5 after ATRA treatment. All images were acquired at the same magnification. Scale bar, 5 μm. B, to quantitatively describe nuclear shape, the circularity of the nucleus is defined as 4πA/P2. Histograms show the distribution for each cell type at days 0 and 5 after ATRA treatment. C, box plots show the circularity of nuclei at days 0, 3, and 5 after ATRA treatment. The white bar denotes the population median, boxes are the 25th and 75th percentiles, and lines show the 10th and 90th percentiles. To evaluate statistical significance, we compared the medians of at least 3 independent experiments for each cell type. Day 0, unmodified to scrambled control. n.s., p > 0.05; *, p < 0.05. Nuclei from over 300 individual cells were analyzed for each cell type.
FIGURE 4.
FIGURE 4.
Impaired migration of LamA OE cells through narrow constrictions. To probe the active migration of cells through micron-scale pores, we use a Transwell migration assay. A and D, representative images from a single experiment showing Hoechst-stained nuclei of cells that have passed through 3- or 8-μm pores. Scale bar, 100 μm. Ctrl, control; Scrmbl Ctrl, scrambled control; Mock Ctrl, mock control. B and E, migration efficiency is defined as the number of cells that passaged through the porous membrane relative to the corresponding scrambled or mock control. Bars represent averages from at least three independent experiments; error bars represent S.E. ***, p < 0.001 for LamA OE versus mock control. C and F, two-dimensional migration experiments were performed by tracking the positions of individual cells at 1-min intervals over 3 h. Traces of three representative cells for each cell type show the total distance traveled and the directionality of movement over the three-hour time-lapse experiment. Axes are 150 μm with 50-μm increments. Migration speed over the entire trajectory is computed from the individual traces of over 50 cells for each cell type. Mean values for each LBR KD and LamA OE cells are normalized to their respective controls. n.s., p > 0.05; *, p < 0.05; ***, p < 0.001. Absolute velocities of cells are: LBR KD, 4.4–5.1 μm/min; scrambled control, 3.5–4.2 μm/min; LamA OE, 2.2–4.7 μm/min; mock control, 2.8–4.8 μm/min.
FIGURE 5.
FIGURE 5.
Lamin A levels, rather than nuclear shape, are a primary determinant of the efficiency of cell passage through narrow constrictions. A schematic illustration summarizing the effects of nuclear shape and lamin A expression levels on the ability of cells to deform through narrow constrictions is shown. The ratio of LamA to LBR expression levels is estimated from immunoblots. Undifferentiated (unmodified or mock-modified) HL-60 cells, as well as the LBR KD neutrophil-type cells, exhibit efficient passage, despite their round nuclear shape. By contrast, lamin A overexpression results in impaired passage, both through the constricted 5-μm channels of a microfluidic device, as well as the 3- and 8-μm pores of the transwell migration assay. Undifferentiated LamA OE cells with more circular nuclei and lower levels of LBR require even longer time to passage through narrow constrictions.

References

    1. Doerschuk C. M., Beyers N., Coxson H. O., Wiggs B., Hogg J. C. (1993) Comparison of neutrophil and capillary diameters and their relation to neutrophil sequestration in the lung. J. Appl. Physiol. 74, 3040–3045 - PubMed
    1. Worthen G. S., Schwab B., 3rd, Elson E. L., Downey G. P. (1989) Mechanics of stimulated neutrophils: cell stiffening induces retention in capillaries. Science 245, 183–186 - PubMed
    1. Downey G. P., Worthen G. S., Henson P. M., Hyde D. M. (1993) Neutrophil sequestration and migration in localized pulmonary inflammation. Capillary localization and migration across the interalveolar septum. Am. Rev. Respir. Dis. 147, 168–176 - PubMed
    1. Tsai M. A., Waugh R. E., Keng P. C. (1998) Passive mechanical behavior of human neutrophils: effects of colchicine and paclitaxel. Biophys. J. 74, 3282–3291 - PMC - PubMed
    1. Tsai M. A., Frank R. S., Waugh R. E. (1994) Passive mechanical behavior of human neutrophils: effect of cytochalasin B. Biophys. J. 66, 2166–2172 - PMC - PubMed

Publication types

LinkOut - more resources