

Functional connectivity of human chewing: an fcMRI study
- PMID: 23355525
- PMCID: PMC3576996
- DOI: 10.1177/0022034512472681
Functional connectivity of human chewing: an fcMRI study
Abstract
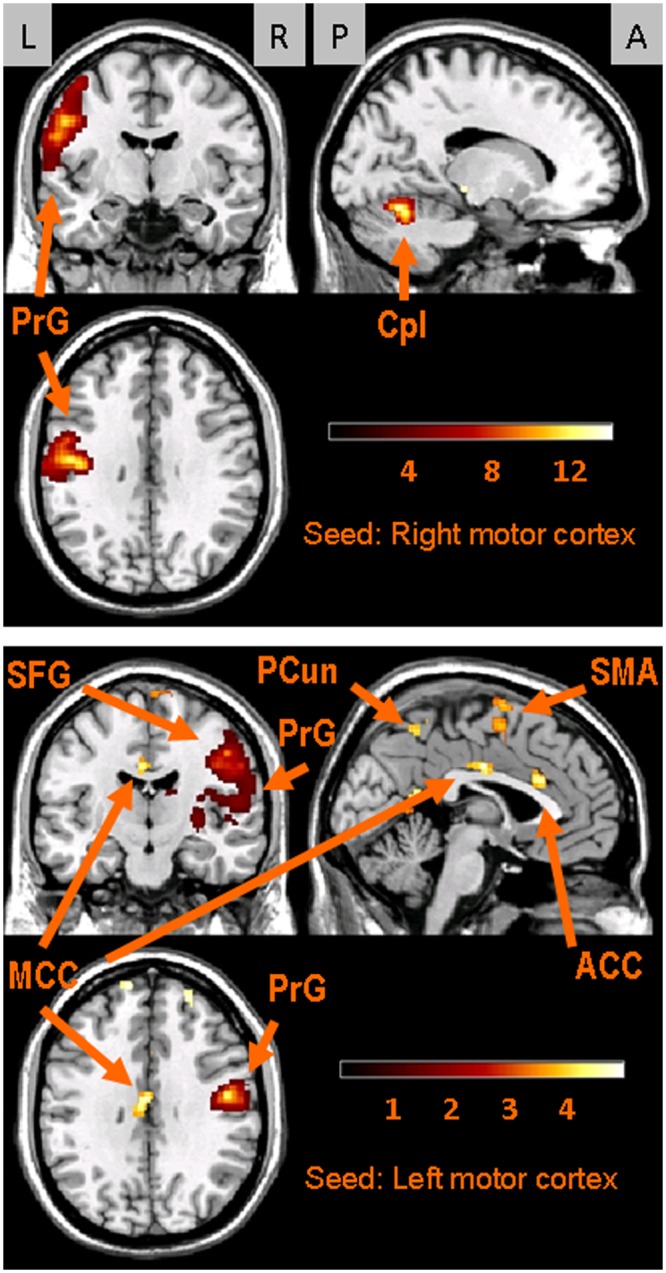
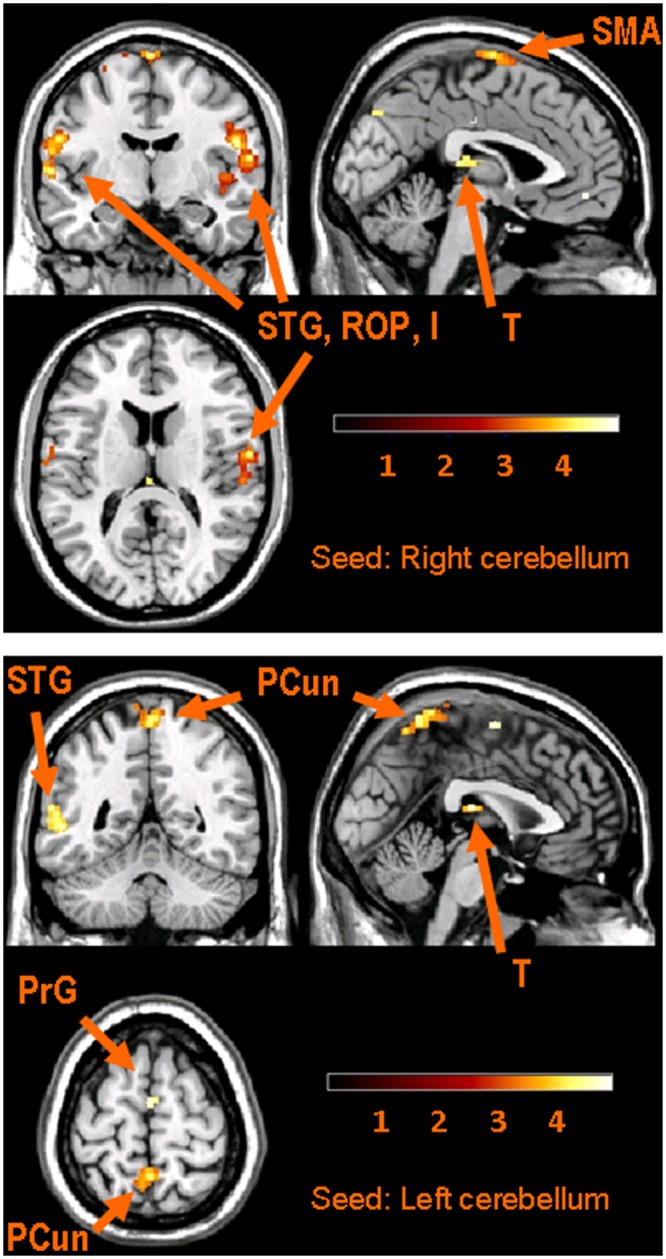
Mastication is one of the most important orofacial functions. The neurobiological mechanisms of masticatory control have been investigated in animal models, but less so in humans. This project used functional connectivity magnetic resonance imaging (fcMRI) to assess the positive temporal correlations among activated brain areas during a gum-chewing task. Twenty-nine healthy young-adults underwent an fcMRI scanning protocol while they chewed gum. Seed-based fcMRI analyses were performed with the motor cortex and cerebellum as regions of interest. Both left and right motor cortices were reciprocally functionally connected and functionally connected with the post-central gyrus, cerebellum, cingulate cortex, and precuneus. The cerebellar seeds showed functional connections with the contralateral cerebellar hemispheres, bilateral sensorimotor cortices, left superior temporal gyrus, and left cingulate cortex. These results are the first to identify functional central networks engaged during mastication.
Conflict of interest statement
The authors declare no potential conflicts of interest with respect to the authorship and/or publication of this article.
Figures
Similar articles
-
Brain activity and human unilateral chewing: an FMRI study.J Dent Res. 2013 Feb;92(2):136-42. doi: 10.1177/0022034512466265. Epub 2012 Oct 26. J Dent Res. 2013. PMID: 23103631 Free PMC article.
-
Age-related changes in brain regional activity during chewing: a functional magnetic resonance imaging study.J Dent Res. 2003 Aug;82(8):657-60. doi: 10.1177/154405910308200817. J Dent Res. 2003. PMID: 12885854
-
Symmetry of fMRI activation in the primary sensorimotor cortex during unilateral chewing.Clin Oral Investig. 2017 May;21(4):967-973. doi: 10.1007/s00784-016-1858-4. Epub 2016 May 24. Clin Oral Investig. 2017. PMID: 27221516
-
Chewing-side preference is involved in differential cortical activation patterns during tongue movements after bilateral gum-chewing: a functional magnetic resonance imaging study.J Dent Res. 2004 Oct;83(10):762-6. doi: 10.1177/154405910408301005. J Dent Res. 2004. PMID: 15381715
-
Neuroimaging meta-analysis of brain mechanisms of the association between orofacial pain and mastication.J Oral Rehabil. 2023 Oct;50(10):1070-1081. doi: 10.1111/joor.13526. Epub 2023 Jun 9. J Oral Rehabil. 2023. PMID: 37252887 Review.
Cited by
-
Mastication Influences Human Brain Anatomy.J Oral Maxillofac Res. 2024 Dec 31;15(4):e4. doi: 10.5037/jomr.2024.15404. eCollection 2024 Oct-Dec. J Oral Maxillofac Res. 2024. PMID: 40017684 Free PMC article.
-
Brain-derived neurotrophic factor is related to stress and chewing in saliva and salivary glands.Jpn Dent Sci Rev. 2020 Dec;56(1):43-49. doi: 10.1016/j.jdsr.2019.11.001. Epub 2019 Dec 13. Jpn Dent Sci Rev. 2020. PMID: 31879531 Free PMC article. Review.
-
Gray Matter Volume and Resting-State Functional Connectivity of the Motor Cortex-Cerebellum Network Reflect the Individual Variation in Masticatory Performance in Healthy Elderly People.Front Aging Neurosci. 2016 Jan 7;7:247. doi: 10.3389/fnagi.2015.00247. eCollection 2015. Front Aging Neurosci. 2016. PMID: 26779015 Free PMC article.
-
Cross-modal representation of chewing food in posterior parietal and visual cortex.PLoS One. 2024 Oct 25;19(10):e0310513. doi: 10.1371/journal.pone.0310513. eCollection 2024. PLoS One. 2024. PMID: 39453981 Free PMC article.
-
Functional Adaptation of Oromotor Functions and Aging: A Focused Review of the Evidence From Brain Neuroimaging Research.Front Aging Neurosci. 2020 Jan 9;11:354. doi: 10.3389/fnagi.2019.00354. eCollection 2019. Front Aging Neurosci. 2020. PMID: 31998112 Free PMC article. Review.
References
-
- Abrahamsen R, Dietz M, Lodahl S, Roepstorff A, Zachariae R, Østergaard L, et al. (2010). Effect of hypnotic pain modulation on brain activity in patients with temporomandibular disorder pain. Pain 151:825-833. - PubMed
-
- Avivi-Arber L, Martin R, Lee J-C, Sessle BJ. (2011). Face sensorimotor cortex and its neuroplasticity related to orofacial sensorimotor functions. Arch Oral Biol 56:1440-1465. - PubMed
-
- Brodal P. (1978). The corticopontine projection in the rhesus monkey. Origin and principles of organization. Brain 101:251-283. - PubMed
-
- Byrd KE, Luschei ES. (1980). Cerebellar ablation and mastication in the guinea pig ( Cavia porcellus). Brain Res 197:577-581. - PubMed
Publication types
MeSH terms
Substances
Grants and funding
LinkOut - more resources
Full Text Sources
Other Literature Sources
Medical
