. 2013 Apr 4;121(14):2773-84.
doi: 10.1182/blood-2012-06-435727. Epub 2013 Jan 25.

Cellular and molecular basis of von Willebrand disease: studies on blood outgrowth endothelial cells

Affiliations

Cellular and molecular basis of von Willebrand disease: studies on blood outgrowth endothelial cells

Richard D Starke et al. Blood. .

Abstract

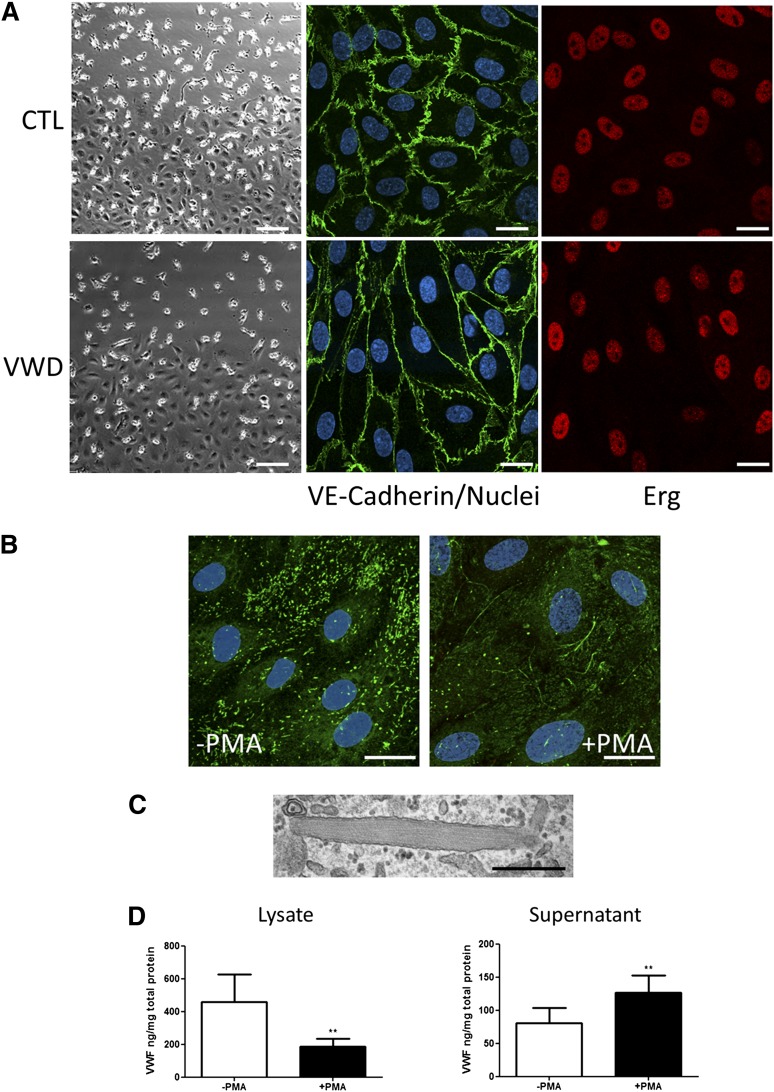
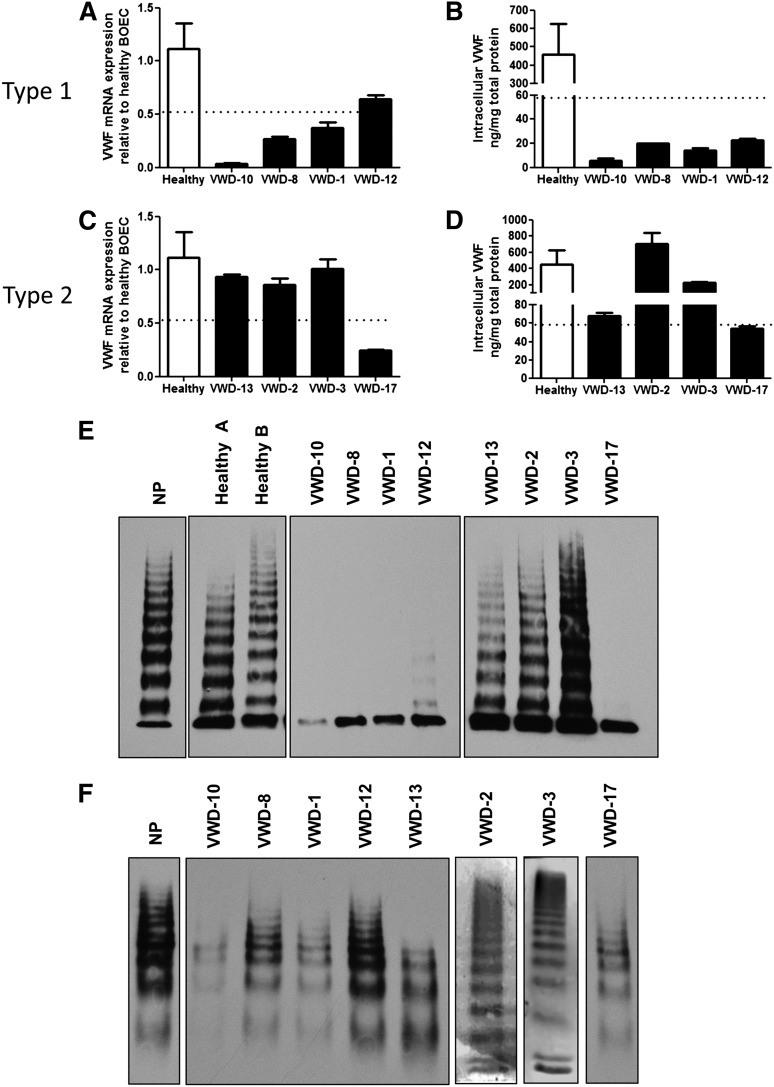
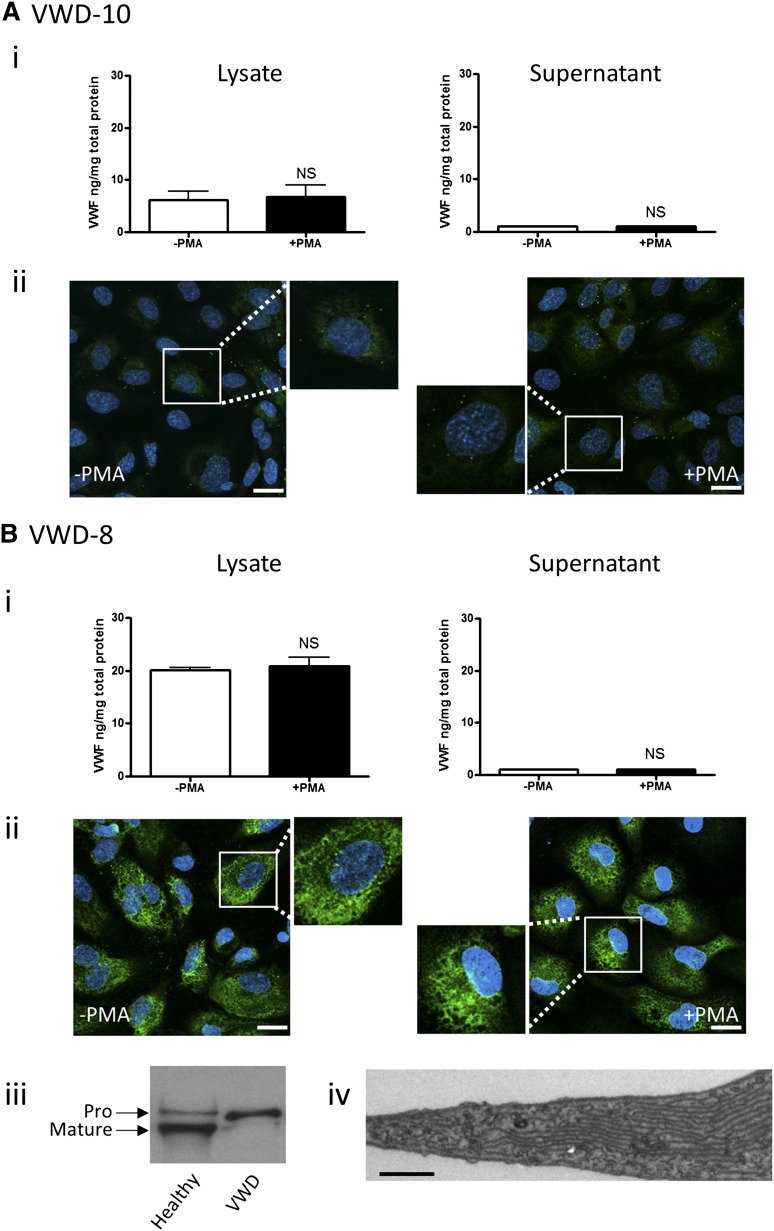
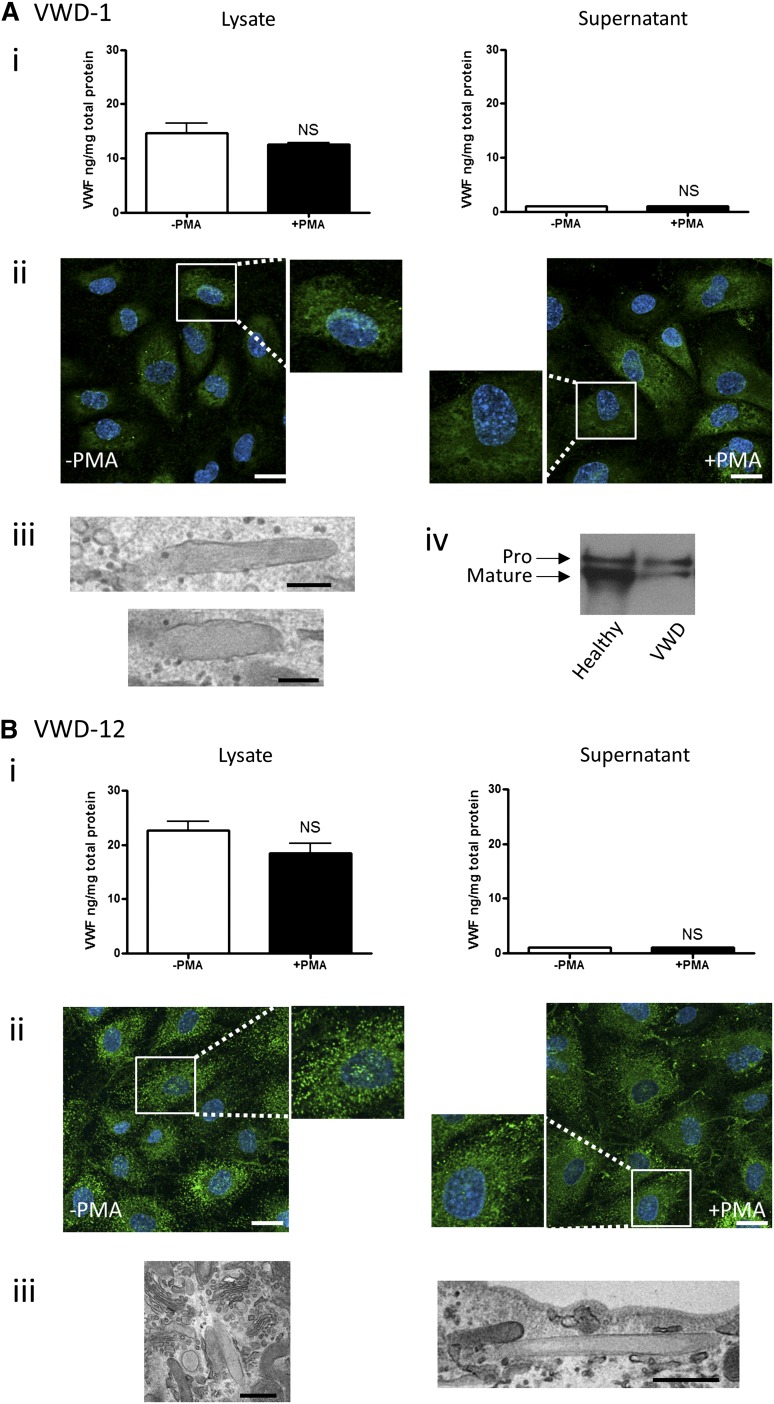
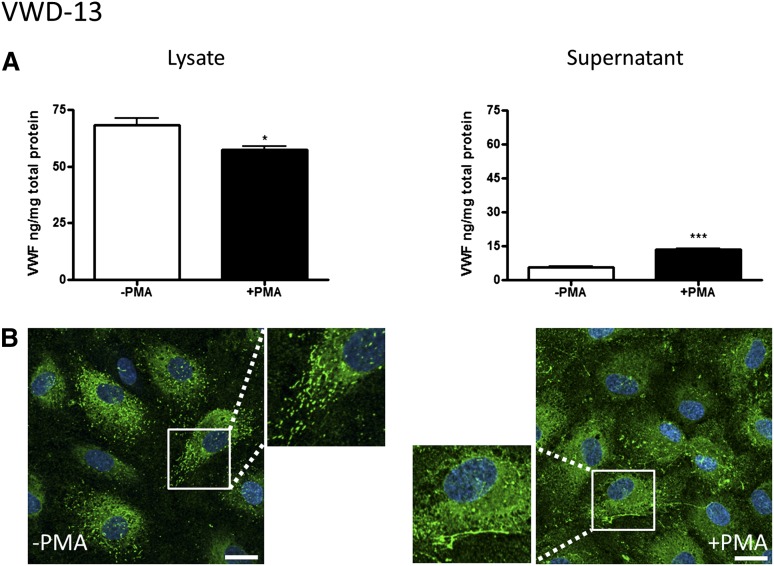
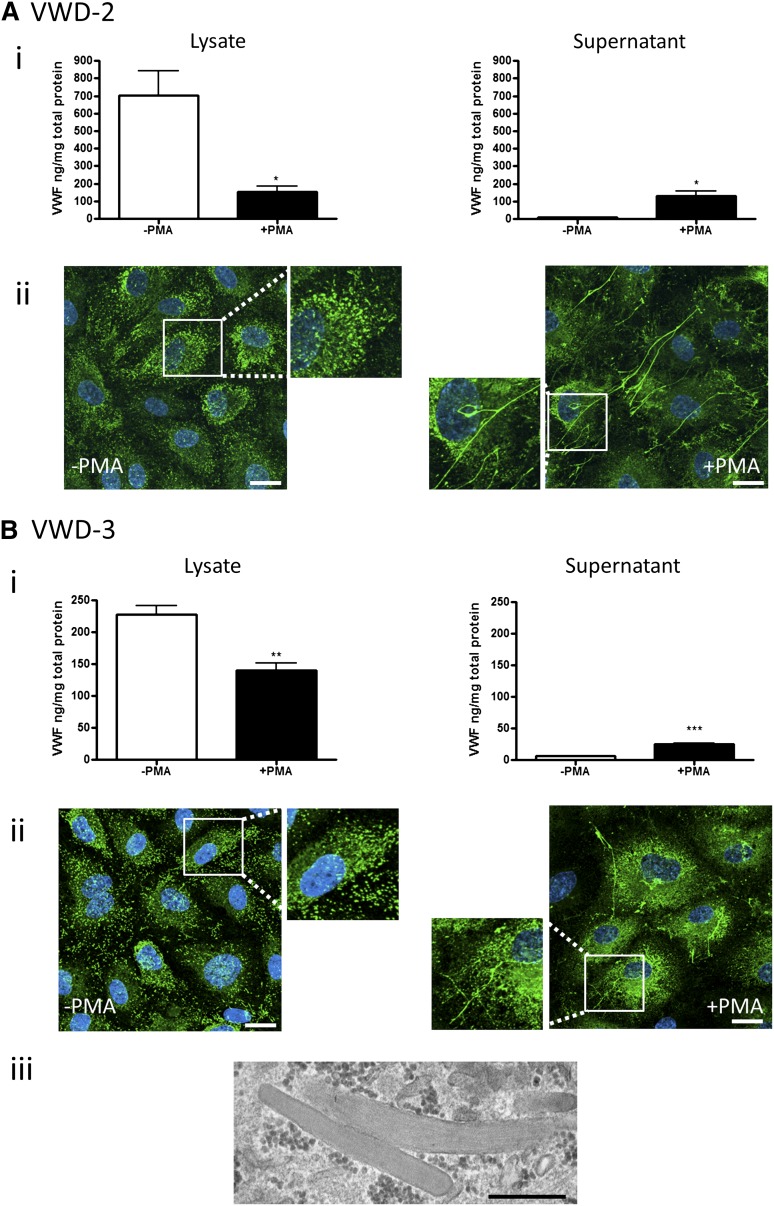
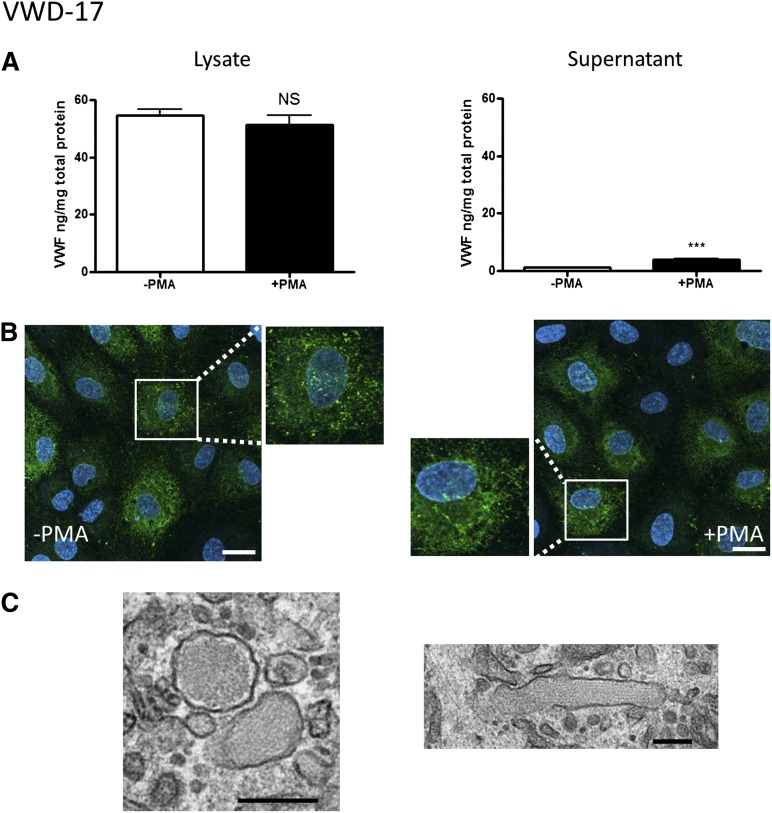
Von Willebrand disease (VWD) is a heterogeneous bleeding disorder caused by decrease or dysfunction of von Willebrand factor (VWF). A wide range of mutations in the VWF gene have been characterized; however, their cellular consequences are still poorly understood. Here we have used a recently developed approach to study the molecular and cellular basis of VWD. We isolated blood outgrowth endothelial cells (BOECs) from peripheral blood of 4 type 1 VWD and 4 type 2 VWD patients and 9 healthy controls. We confirmed the endothelial lineage of BOECs, then measured VWF messenger RNA (mRNA) and protein levels (before and after stimulation) and VWF multimers. Decreased mRNA levels were predictive of plasma VWF levels in type 1 VWD, confirming a defect in VWF synthesis. However, BOECs from this group of patients also showed defects in processing, storage, and/or secretion of VWF. Levels of VWF mRNA and protein were normal in BOECs from 3 type 2 VWD patients, supporting the dysfunctional VWF model. However, 1 type 2M patient showed decreased VWF synthesis and storage, indicating a complex cellular defect. These results demonstrate for the first time that isolation of endothelial cells from VWD patients provides novel insight into cellular mechanisms of the disease.


Figures

Figure 1
Figure 1
BOEC characterization and activation with PMA. (A) Representative images at the edge of a confluent colony of BOECs from a healthy control (top far left) and VWD patient (bottom far left). Scale bars represent 100 µm. Colonies of confluent BOECs were stained for VE-cadherin and Erg. Nuclei were stained with TO-PRO3 (scale bars represent 20 µm). (B) Representative image of healthy control BOECs stimulated with PMA or control to induce WPB exocytosis. BOECs were stained for IF with antibody to VWF and TO-PRO3 to identify the nuclei. Strings of VWF can be seen associated with the cell surface in the PMA-treated samples (scale bars represent 20 µm). (C) Representative EM image of a single WPB from a healthy control BOEC (scale bar represents 500 nm). (D) BOEC VWF was quantified by ELISA in total cellular lysate (left) or in cell culture supernatant (right) in the presence or absence of PMA stimulation (mean ± SEM from 9 healthy controls). **P < .01.
Figure 2
Figure 2
Expression of VWF in plasma and BOECs from type 1 and 2 VWD patients. (A,C) Real-time RT-PCR with primers specific for VWF was performed on RNA isolated from BOECs from 4 healthy controls and from type 1 (A) or type 2 (C) VWD patients. The VWF expression was normalized to glyceraldehyde-3-phosphate dehydrogenase, and all samples were normalized to 1 healthy control. The mean expression of controls was 1.12 (range, 0.52-1.70). (B,D) VWF protein was measured in total cellular lysates from healthy control BOECs (mean, 458 ng/mg total protein; range, 59-1390) and type 1 (B) or 2 (D) VWD BOECs with a VWF ELISA. In (A-D), the dotted line indicates the lowest value in healthy donors for mRNA and protein, as the lower limit of the normal range (mean ± SEM from 4 to 9 healthy controls, see “Materials and methods”). (E,F) VWF multimer analysis of VWF from BOEC lysates (E) or plasma (F).
Figure 3
Figure 3
BOEC characterization: type 1 VWD. Data from patient VWD-10 (A) and patient VWD-8 (B). (Ai,Bi) VWF was measured by ELISA in the total cell lysate (left) and cell culture supernatant (right) from BOECs isolated from the indicated patient, in the absence and presence of PMA stimulation (mean ± SEM from 3 replicates). (Aii,Bii) VWF expression from control or PMA-stimulated BOECs was visualized by confocal IF microscopy (scale bars represent 20 µm). Boxes show 2× magnified image. (Biii) Mature and propeptide-containing VWF was detected by western blotting from a healthy control or VWD patient VWD-8. Equal amounts of VWF were loaded per lane. (Biv) Representative image from EM analysis of BOECs from VWD patient VWD-8 shows extensive ER (scale bar represents 200 nm).
Figure 4
Figure 4
BOEC characterization: type 1 VWD. Data from patient VWD-1 (A) and patient VWD-12 (B). (Ai,Bi) VWF was measured by ELISA in the total cell lysate (left) and cell culture supernatant (right) from BOECs isolated from the indicated patient in the absence and presence of PMA stimulation (mean ± SEM from 3 replicates). (Aii,Bii) VWF expression from control or PMA-stimulated BOECs was visualized by confocal IF microscopy (scale bars represent 20 µm). Boxes show 2× magnified image. EM analysis of BOECs show elongated (Aiii,Biii) or rounded WPBs (Biii) (scale bars represent 200 nm in Aiii and 500 nm in Biii). (Aiv) Mature and propeptide-containing VWF was detected by western blotting from a healthy control and VWD-1. Equal amounts of VWF were loaded per lane.
Figure 5
Figure 5
BOEC characterization: type 2A VWD. (A-B) Data from patient VWD-13. (A) VWF was measured by ELISA in the total cell lysate (left) and cell culture supernatant (right) from BOECs isolated from a type 2A VWD patient in the absence and presence of PMA stimulation (mean ± SEM from 3 replicates). (B) VWF expression from control or PMA-stimulated BOECs was visualized by confocal IF microscopy (scale bars represent 20 µm). Boxes show 2× magnified image. *P < .05; ***P < .001.
Figure 6
Figure 6
BOEC characterization: type 2M VWD family. Data from patient VWD-2 (A) and patient VWD-3 (B). (Ai,Bi) VWF was measured by ELISA in the total cell lysate (left) and cell culture supernatant (right) from BOECs isolated from the indicated patient in the absence and presence of PMA stimulation (mean ± SEM from 3 replicates). (Aii,Bii) VWF expression in control or PMA-stimulated BOECs was visualized by confocal IF microscopy (scale bars represent 20 µm). Boxes show 2× magnified image. (Biii) Representative image from EM analysis (scale bar represents 500 nm) of BOECs from patient VWD-3 illustrates the presence of morphologically normal WPBs. *P < .05; ** P < .01; ***P < .001.
Figure 7
Figure 7
BOEC characterization: type 2M VWD. (A-C) Data from patient VWD-17. (A) VWF was measured by ELISA in the total cell lysate (left) and cell culture supernatant (right) from BOECs in the absence or presence of PMA stimulation (mean ± SEM from 3 replicates). (B) VWF expression from control and PMA-stimulated BOECs was visualized by confocal IF microscopy (scale bars represent 20 µm). Boxes show 2× magnified image. (C) EM analysis of BOECs (scale bars represent 200 nm) shows the presence of rounded WPBs (left), plus a rare elongated WPB (right). ***P < .001.

Comment in

References

    1. Nichols WC, Ginsburg D. von Willebrand disease. Medicine (Baltimore) 1997;76(1):1–20. - PubMed
    1. James PD, Lillicrap D. von Willebrand disease: clinical and laboratory lessons learned from the large von Willebrand disease studies. Am J Hematol. 2012;87(suppl 1):S4–S11. - PMC - PubMed
    1. Giblin JP, Hewlett LJ, Hannah MJ. Basal secretion of von Willebrand factor from human endothelial cells. Blood. 2008;112(4):957–964. - PubMed
    1. Metcalf DJ, Nightingale TD, Zenner HL, et al. Formation and function of Weibel-Palade bodies. J Cell Sci. 2008;121(pt 1):19–27. - PubMed
    1. Starke RD, Ferraro F, Paschalaki KE, et al. Endothelial von Willebrand factor regulates angiogenesis. Blood. 2011;117(3):1071–1080. - PMC - PubMed

Publication types

MeSH terms