. 2013 Mar 1;41(5):2918-31.
doi: 10.1093/nar/gks893. Epub 2013 Jan 25.

Effects of DNA methylation on nucleosome stability

Affiliations

Effects of DNA methylation on nucleosome stability

Clayton K Collings et al. Nucleic Acids Res. .

Abstract

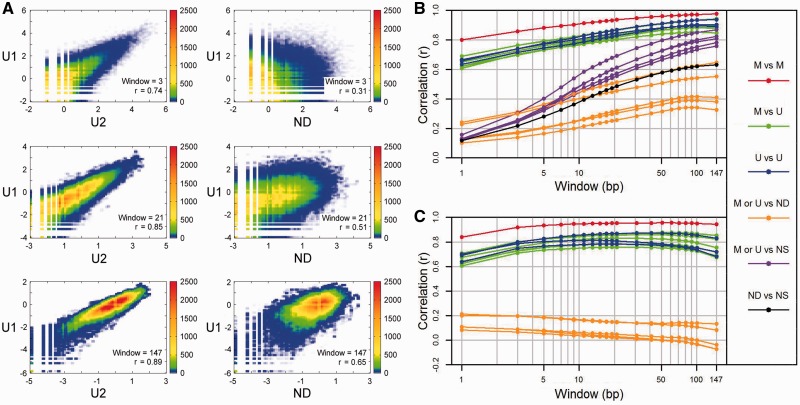
Methylation of DNA at CpG dinucleotides represents one of the most important epigenetic mechanisms involved in the control of gene expression in vertebrate cells. In this report, we conducted nucleosome reconstitution experiments in conjunction with high-throughput sequencing on 572 KB of human DNA and 668 KB of mouse DNA that was unmethylated or methylated in order to investigate the effects of this epigenetic modification on the positioning and stability of nucleosomes. The results demonstrated that a subset of nucleosomes positioned by nucleotide sequence was sensitive to methylation where the modification increased the affinity of these sequences for the histone octamer. The features that distinguished these nucleosomes from the bulk of the methylation-insensitive nucleosomes were an increase in the frequency of CpG dinucleotides and a unique rotational orientation of CpGs such that their minor grooves tended to face toward the histones in the nucleosome rather than away. These methylation-sensitive nucleosomes were preferentially associated with exons as compared to introns while unmethylated CpG islands near transcription start sites became enriched in nucleosomes upon methylation. The results of this study suggest that the effects of DNA methylation on nucleosome stability in vitro can recapitulate what has been observed in the cell and provide a direct link between DNA methylation and the structure and function of chromatin.


Figures

Figure 1.
Figure 1.
Low to high resolution comparisons among the human nucleosome and control libraries. (A) 2D color-coded scatter plot comparisons between two unmethylated nucleosome libraries (U1 versus U2) and between one unmethylated nucleosome library and the naked MNase-digested DNA library (U1 versus ND). For each comparison at high, medium and low resolutions using windows of 3, 21 and 147 bp, respectively, the numbers of normalized reads in log ratios at each position were plotted, and the colors over the scatter plot represent the numbers of positions that are plotted within small square regions of the plot. The log ratio at each position is equal to log(x + c) − log(y + c) where ‘x’ is the number of reads of a given window length (symmetrically extended from midpoints) overlapping a certain position, ‘y’ is the average number of reads of a given window length in the library overlapping each position and ‘c’ is a small constant to avoid undefined values associated with ‘zero’ data. Therefore, a log ratio of 0 indicates that the number of reads of a given window length overlapping a certain position is equal to the average number of reads in the library for the given window. Pearson’s correlation coefficients (r) are indicated. (B) Correlations (r) as a function of window width for the 21 possible individual library comparisons. For different window widths, r-values derived from comparisons as in (A) between the methylated nucleosome libraries (M, red), between the unmethylated nucleosome libraries (U, blue), between the unmethylated and methylated nucleosome libraries (green), between the nucleosome libraries and the naked MNase-digested DNA library (ND, orange), between the nucleosome libraries and the naked sonicated DNA library (NS, purple), and between the two controls (black) are plotted. (C) Correlations (r) as a function of window width after removing the sonicated data as background. Same as in (B) except comparisons between libraries were made after the sonicated data were subtracted from the nucleosome and MNase control libraries as background (Supplementary Methods).
Figure 2.
Figure 2.
Frequency profiles of the AnTm and RGCY tetranucleotide consensus sequences in the nucleosome and control libraries for the human data. The tetranucleotide fractions of occurrence for AnTm (n + m = 4, no TA steps) and RGCY were generated from forward and reverse complement sequences centered on midpoints for the combined unmethylated nucleosome library (blue), the combined methylated nucleosome library (red), the naked MNase-digested DNA library (orange), and the naked sonicated DNA library (purple).
Figure 3.
Figure 3.
Differential nucleosome positioning between the unmethylated and methylated conditions for the human data. (A) An example from the data. One strongly positioned, methylation-sensitive (MS) nucleosome identified by DESeq overlaps the 8th exon in the TP53 gene while another strongly positioned but methylation-insensitive (MI) nucleosome occupies part of the 7th exon. The numbers of normalized reads from nucleosomes at midpoints in 3 and 25 bp sliding window sums are plotted as a function of position for the combined unmethylated (green and blue) and methylated (orange and red) libraries. The positions reflect BAC coordinates. (B,C) Differential nucleosome affinity analysis by DESeq. In (B), the negative log (base 10) of the adjusted P-values that resulted from tests between the 3 unmethylated and 2 methylated libraries for 11 448 positions are plotted against fractional difference (FD). The green and orange horizontal lines represent adjusted P-values of 0.05 and 0.5, respectively. Nucleosomes in red have >60 normalized reads in one of the combined unmethylated or methylated libraries. In (C), FD is plotted against the base mean of normalized reads for the five libraries. Nucleosomes in green and orange have adjusted P-values <0.05 and >0.5, respectively. (D) Position cluster analysis. For all peaks at the 11 448 nucleosome midpoint positions, the numbers of normalized reads at midpoints in 3 bp sums for the combined unmethylated and methylated nucleosome libraries were cumulatively added according to the distance at which they occurred. Note that since the data are in 3 bp sums, the highest peak occurs at position 1 rather than position 0. (E) Eighty-eight MS sites sorted by affinity. The number of normalized reads from each nucleosome library is plotted where the FD is >0.7 and the number of normalized reads in the combined methylated library is >60. The ‘X’ above Site #4 represents the MS nucleosome in the 8th exon of TP53 (Figure 1A). (F) CpG frequency analysis. For five FD ranges indicated by the key, the fraction of sites that contain the indicated number of CpGs is plotted.
Figure 4.
Figure 4.
Periodicities and rotational orientations of dinucleotides and tetranucleotides in unmethylated and methylated nucleosomes. (A) Occurrences of CpG and selected CpG-tetranucleotides in methylation-sensitive nucleosomes. The CpG fractional occurrences along nucleosomal DNA from the unmethylated over methylated (U > M) nucleosomes (blue, P-value < 0.05, FD < 0) and methylated over unmethylated (M > U) nucleosomes (red, P-value < 0.05, FD > 0) are plotted. The frequency profiles of CpG from the U > M nucleosomes exhibit an outward-facing minor groove periodicity whereas the M > U nucleosomes face inward. The selected CpG tetranucleotides are indicated by the asterices, which designate 13 CpG tetranucleotides that face inward in the M > U nucleosomes (Figure 4C), and their occurrences along nucleosomal DNA from the U > M nucleosomes (green) and the M > U nucleosomes (orange) are plotted. (B) Fourier transform spectra from frequency profiles in Figure 4A (using corresponding colors). The normalized amplitudes (Supplementary Methods) versus period are graphed for the U > M and M > U CpG and selected CpG tetranucleotide profiles. (C) Rotational orientation strengths of dinucleotides, CpG tetranucleotides and the eight tetranucleotide consensus sequences. The strengths of the outward (blue) and inward (red) periodicities are indicated in the level plot for the six libraries (Supplementary Methods). The nine equal signs next to the CpG tetranucleotides designate those that possess inward-facing periodicities in both the methylated Arabidopsis nucleosomes and the M > U nucleosomes. The prevalence of whites and pale reds/blues for the tetranucleotides in our study likely reflects the limited sequence space (Figure 4C).
Figure 5.
Figure 5.
Nucleosome positioning of MI and MS nucleosomes for the human data. (A) Nucleosome position enrichment within features. For the U > M [P < 0.05, FD < 0], U = M [P > 0.5], M > U [P < 0.05, FD > 0], and M > U [FD > 0.7] nucleosome sub-libraries, there were 877, 3600, 1723 and 514 nucleosomes, respectively. With these nucleosome numbers and the numbers of positions that certain features occupied within the reference sequence, ratios of actual over expected numbers of nucleosome occurrence at midpoints were calculated within features. (B) Nucleosome positioning near TSSs. Strongly positioned MS and MI nucleosomes with high affinity and translational positioning activity are displayed near the TSSs of the 12 genes (Supplementary Figure S1) within the reference sequence. Nucleosomes with small numbers of reads and/or low translational positioning activity are not displayed (Supplementary Methods). The numbers above nucleosomes are adjusted P-values obtained from DESeq.
Figure 6.
Figure 6.
Nucleosome enrichment of MS nucleosomes for the human data. (A) Nucleosome enrichment within BACs. For this analysis, the MS nucleosomes were from the M > U [P < 0.05, FD > 0] nucleosome sub-library, containing 1723 nucleosomes, and the remaining 9725 (11 448 − 1723) nucleosomes were defined as being MI. With these nucleosome numbers and the numbers of positions that the BACs occupied within the reference sequence, ratios of actual over expected numbers of nucleosome occurrence at midpoints were calculated. CG and G + C (-CG) enrichment was calculated with respect to the CG and G + C (-CG) content for the entire reference sequence or the three BACs combined. (B) Nucleosome enrichment within exons of individual genes. For the 12 genes, the numbers of MI and MS nucleosomes were computed in exons. With these nucleosome numbers and the numbers of positions that the exons of certain genes occupied within the reference sequence, ratios of actual over expected numbers of nucleosome midpoint occurrence were calculated. Again, CG and G + C (-CG) enrichment was calculated with respect to the CG and G + C (-CG) content for the entire reference sequence. (C) Nucleosome exon-over-intron enrichment for individual genes. For the 12 genes, the numbers of MI and MS nucleosomes were computed in exons and introns. With these nucleosome numbers and the numbers of positions that the exons and introns of certain genes occupied, ratios of nucleosomes per exon length over nucleosomes per intron length were calculated. CG and G + C (-CG) exon-over-intron enrichment was calculated for each individual gene.

Similar articles

Cited by

References

    1. Jones P, Baylin S. The epigenomics of cancer. Cell. 2007;128:683–692. - PMC - PubMed
    1. Feil R. Epigenetics: ready for the marks. Nature. 2009;461:359–360. - PubMed
    1. Lee J. Gracefully ageing at 50, X-chromosome inactivation becomes a paradigm for RNA and chromatin control. Nat. Rev. Mol. Cell Biol. 2011;12:815–826. - PubMed
    1. Cedar H, Bergman Y. Linking DNA methylation and histone modification: patterns and paradigms. Nat. Rev. Genet. 2009;10:295–304. - PubMed
    1. Bird A. The Dinucleotide CG as a Genomic Signalling Module. J. Mol. Biol. 2011;409:47–53. - PubMed

Publication types