. 2013 Apr;127(2):151-63.
doi: 10.1037/a0031618. Epub 2013 Jan 28.

Line bisection in Parkinson's disease: investigation of contributions of visual field, retinal vision, and scanning patterns to visuospatial function

Affiliations

Line bisection in Parkinson's disease: investigation of contributions of visual field, retinal vision, and scanning patterns to visuospatial function

Thomas M Laudate et al. Behav Neurosci. 2013 Apr.

Abstract

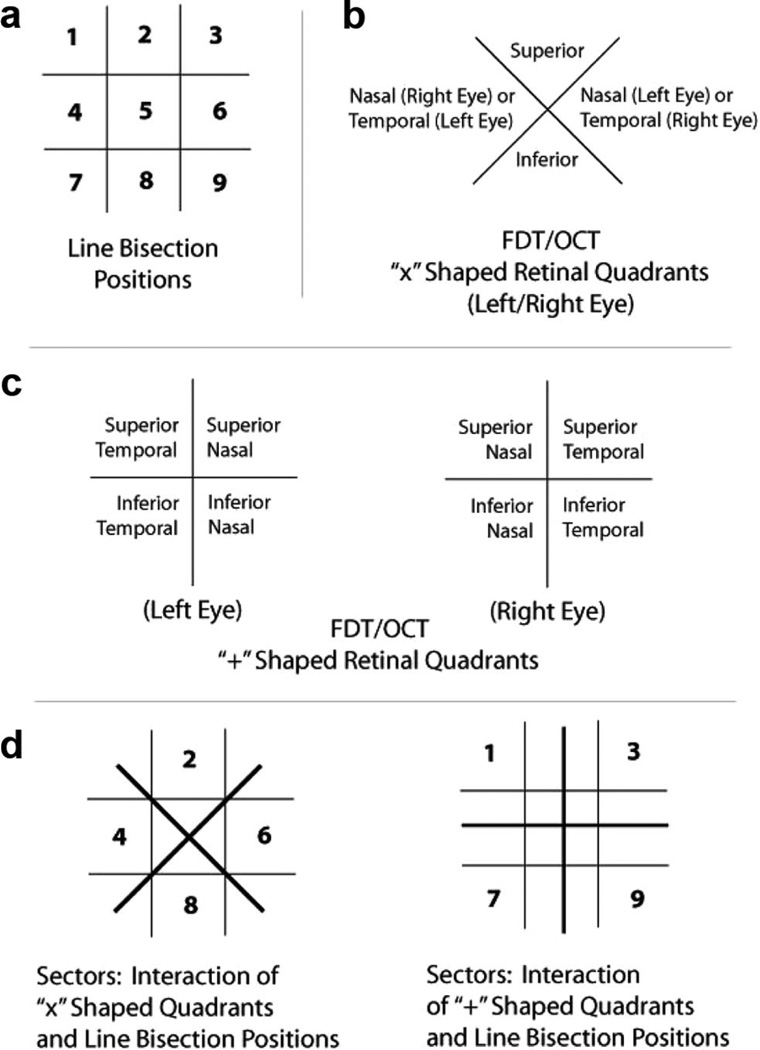
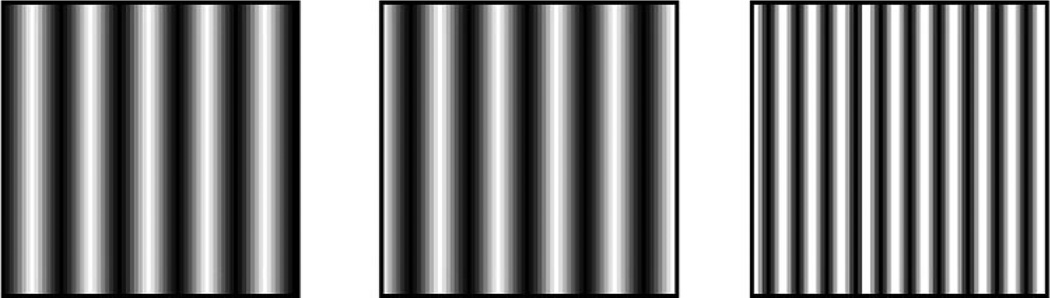
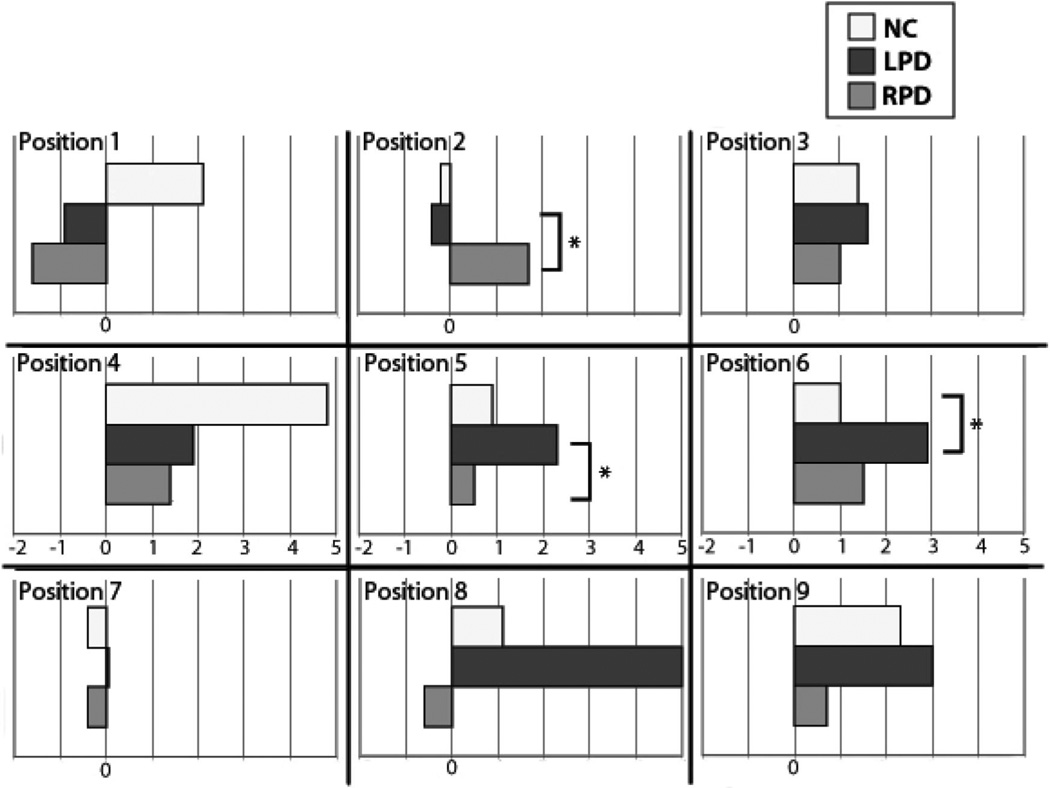
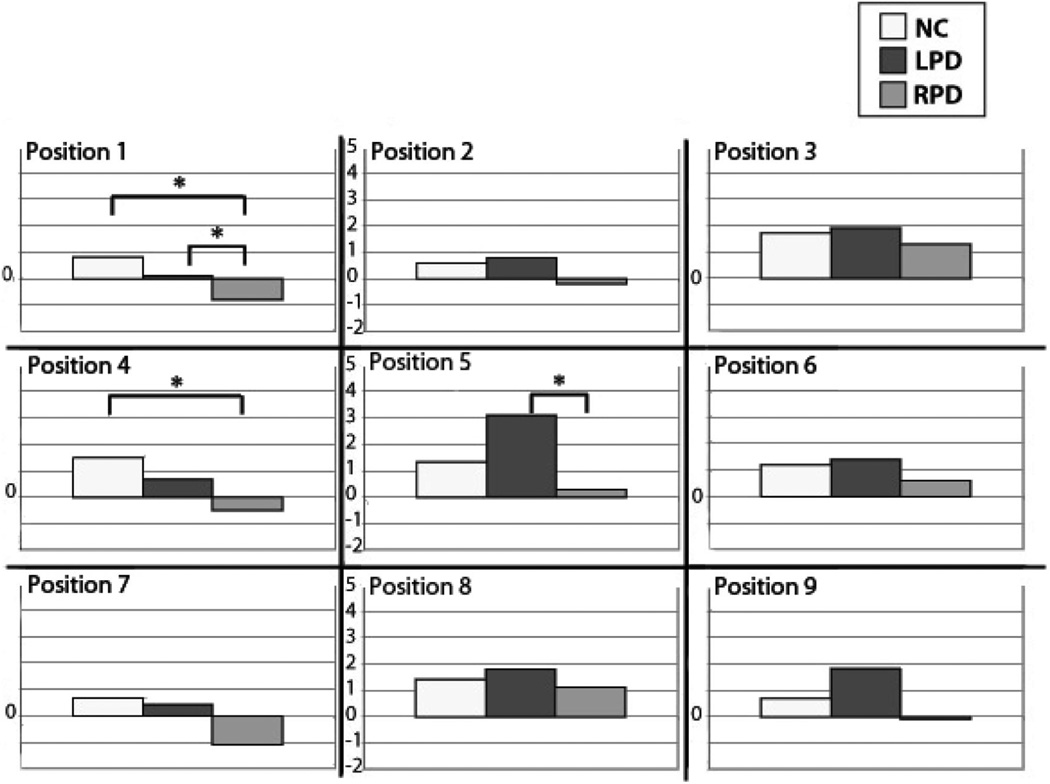
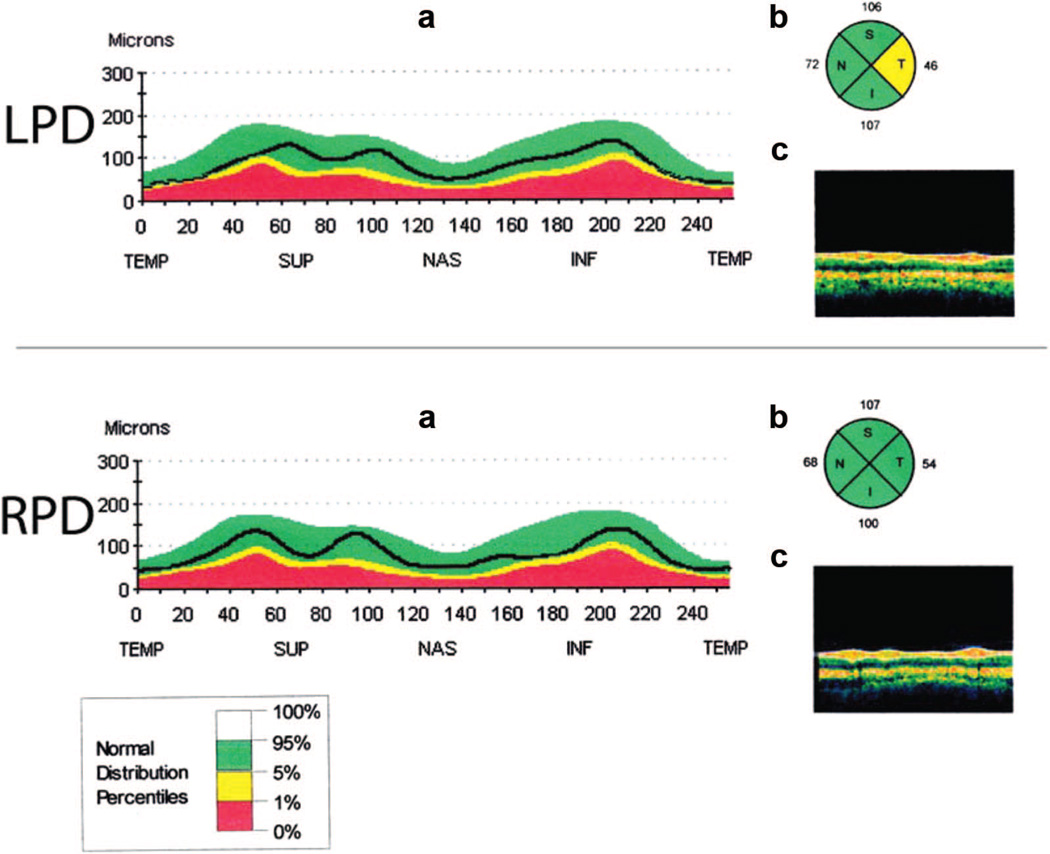
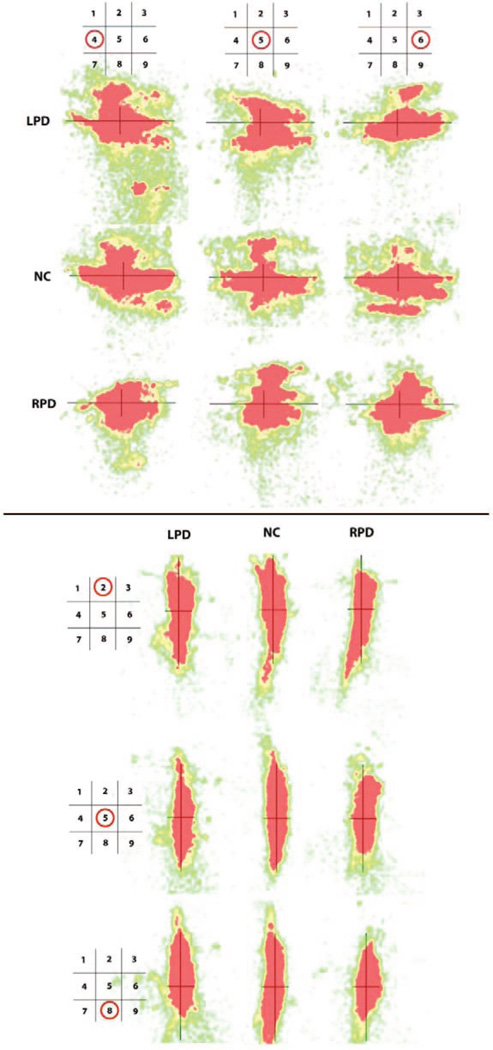
Parkinson's disease (PD) is characterized by disorders of visuospatial function that can impact everyday functioning. Visuospatial difficulties are more prominent in those whose motor symptoms begin on the left body side (LPD) than the right body side (RPD) and have mainly been attributed to parietal dysfunction. The source of visuospatial dysfunction is unclear, as in addition to subcortical-cortical changes, there are irregularities of visual scanning and potentially of retinal-level vision in PD. To assess these potential contributors, performance on a visuospatial task--line bisection--was examined together with retinal structure (nerve fiber layer thickness, measured by optical coherence tomography [OCT]), retinal function (contrast sensitivity, measured by frequency-doubling technology [FDT]), and visual scanning patterns. Participants included 20 nondemented patients (10 LPD, 10 RPD) and 11 normal control (NC) adults. Relative to the other groups, LPD were expected to show rightward bias on horizontal line bisection, especially within the left visual hemispace, and downward bias on vertical bisection. LPD relative rightward bias was confirmed, though not mainly within the left hemispace and not correlated with retinal structure or function. Retinal thinning was seen in LPD relative to RPD. Qualitative visualization of eye movements suggested greater LPD exploration of the right than left side of the line during horizontal bisection, and some overall compression of scanning range in RPD (both orientations) and LPD (primarily vertical). Results indicated that rightward visuospatial bias in our LPD sample arose not from abnormalities at the retinal level but potentially from attentional biases, reflected in eye movement patterns.


Figures

Figure 1
Figure 1
Visualization of line bisection positions, frequency-doubling technology (FDT) and optical coherence tomography (OCT) retinal quadrants, and schematics of sectors. Grid lines are for illustrative purposes in this figure and were not visible to the participants. Note: the optics of the lens of the eye invert (top to bottom) and reverse (left to right) an external image that is projected onto the retina. Therefore, in analyses that relate retinal quadrants to line bisection positions (i.e., Figure 1d), retinal quadrants were matched to their corresponding image source location.
Figure 2
Figure 2
An example of the concept of frequency-doubling technology (FDT) stimuli. Rapid alternation of light and dark gradient stripes (represented by the left and center patches) creates the perceived doubling illusion (represented by the patch on the right). The FDT test measures contrast sensitivity across the retina using the “doubled” stimuli. Figure modeled after Levin, 2005
Figure 3
Figure 3
Horizontal line bisection results by screen position and by group. Screen position is indicated (also see Figure 1a). Positive values on the x-axis represent greater rightward bisection bias; negative numbers represent greater leftward bisection bias; zero represents true center. LPD showed a more rightward bisection bias at Positions 5 and 6 than did RPD and NC, respectively. At Position 2, RPD bisected more rightward than LPD. LPD = left-body-onset Parkinson’s disease; NC = normal control participants; RPD = right-body-onset Parkinson’s disease. *p < .05.
Figure 4
Figure 4
Vertical line bisection results by screen position and by group. Screen position is indicated (also see Figure 1a). Positive values on the y-axis represent greater upward bisection bias; negative numbers represent greater downward bisection bias; zero represents true center. LPD bisected more upward than RPD at Position 5. RPD showed a downward bias at Position 1 (compared with NC and LPD) and at Position 4 (compared with NC). LPD = left-body-onset Parkinson’s disease; NC = normal control participants; RPD = right-body-onset Parkinson’s disease. *p < .05.
Figure 5
Figure 5
Retinal nerve fiber layer (RNFL) depictions. Selected elements of an OCT scan output for an individual LPD participant (upper set of figures) and RPD participant (lower set of figures). (a) A linear representation of the RNFL. The black line represents the participant’s RNFL thickness. Colored areas are comparison ranges of a normal distribution (see legend at bottom of figure). Abbreviations of RNFL quadrant names are noted on the lower line of the x-axis. Note the reduced thickness in the temporal quadrant (the black line, far left and far right of the representation) in the LPD but not the RPD example. (b) A circular representation of the RNFL, divided into quadrants. The numbers next to each quadrant represent average thickness in microns. Colors represent normal distribution percentiles (see legend at bottom of figure). The temporal quadrant is indicated by “T” and is reduced in the LPD, but not RPD, example. (c) Representation of the measured retinal layers of the eye. These individual scans were chosen because they are illustrative of group findings (i.e., greater retinal thinning in the temporal quadrant in LPD than in RPD) and are not representative of all members of the group. Pictured scans are of the left eye and are from men. INF or I = inferior RNFL quadrant; LPD = left-body-onset Parkinson’s disease; NAS or N = nasal RNFL quadrant; OCT = optical coherence tomography; RPD = right-body-onset Parkinson’s disease; SUP or S = superior RNFL quadrant; TEMP or T = temporal RNFL quadrant.
Figure 6
Figure 6
Eye tracking “heat map” representations for horizontal (top) and vertical (bottom) line bisection at three visual field positions each. Each of the nine diagrams for each orientation represents where participants looked while performing the line bisection task. Each diagram contains a line bisection stimulus (black lines) for reference and associated eye tracking data. Diagrams are shown for selected screen positions (see schematics at top of columns [horizontal line condition] or left side of rows [vertical line condition] for visual field position), and for LPD, NC, and RPD (by row [horizontal line condition] or column [vertical line condition]). Colors closer to the red end of the spectrum indicate the most time spent looking at those areas, and “cooler” colors indicate progressively less time looking at an area. Each map represents performance across all group members. At some positions, LPD scanning appears to be shifted off-center compared with NC, and compression of scanning area along the line is seen in RPD and LPD compared with NC at some positions. See text for details. LPD = left-body-onset Parkinson’s disease; NC = normal control participants; RPD = right-body-onset Parkinson’s disease.

References

    1. Altintaş O, Işeri P, Ozkan B, Cağlar Y. Correlation between retinal morphological and functional findings and clinical severity in Parkinson’s disease. Documenta Opthalmologica. Advances in Ophthalmology. 2008;116:137–146. - PubMed
    1. Anderson AJ, Johnson CA. Frequency-doubling technology perimetry. Ophthalmology Clinics of North America. 2003;16:213–225. - PubMed
    1. Archibald NK, Clarke MP, Mosimann UP, Burn DJ. The retina in Parkinson’s disease. Brain: A Journal of Neurology. 2009;132:1128–1145. - PubMed
    1. Archibald NK, Clarke MP, Mosimann UP, Burn DJ. Retinal thickness in Parkinson’s disease. Parkinsonism & Related Disorders. 2011;17:431–436. - PubMed
    1. Barber J, Tomer R, Sroka H, Myslobodsky MS. Does unilateral dopamine deficit contribute to depression? Psychiatry Research. 1985;15:17–24. - PubMed

Publication types

MeSH terms