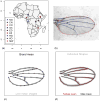
Altitudinal clinal variation in wing size and shape in African Drosophila melanogaster: one cline or many?
- PMID: 23356616
- PMCID: PMC3786396
- DOI: 10.1111/j.1558-5646.2012.01774.x
Altitudinal clinal variation in wing size and shape in African Drosophila melanogaster: one cline or many?
Abstract
Geographical patterns of morphological variation have been useful in addressing hypotheses about environmental adaptation. In particular, latitudinal clines in phenotypes have been studied in a number of Drosophila species. Some environmental conditions along latitudinal clines-for example, temperature-also vary along altitudinal clines, but these have been studied infrequently and it remains unclear whether these environmental factors are similar enough for convergence or parallel evolution. Most clinal studies in Drosophila have dealt exclusively with univariate phenotypes, allowing for the detection of clinal relationships, but not for estimating the directions of covariation between them. We measured variation in wing shape and size in D. melanogaster derived from populations at varying altitudes and latitudes across sub-Saharan Africa. Geometric morphometrics allows us to compare shape changes associated with latitude and altitude, and manipulating rearing temperature allows us to quantify the extent to which thermal plasticity recapitulates clinal effects. Comparing effect vectors demonstrates that altitude, latitude, and temperature are only partly associated, and that the altitudinal shape effect may differ between Eastern and Western Africa. Our results suggest that selection responsible for these phenotypic clines may be more complex than just thermal adaptation.
© 2012 The Author(s). Evolution© 2012 The Society for the Study of Evolution.
Figures


Similar articles
-
Similarities and differences in altitudinal versus latitudinal variation for morphological traits in Drosophila melanogaster.Evolution. 2014 May;68(5):1385-98. doi: 10.1111/evo.12351. Epub 2014 Mar 4. Evolution. 2014. PMID: 24410363
-
Comparative analysis of morphological traits among Drosophila melanogaster and D. simulans: genetic variability, clines and phenotypic plasticity.Genetica. 2004 Mar;120(1-3):165-79. doi: 10.1023/b:gene.0000017639.62427.8b. Genetica. 2004. PMID: 15088656 Review.
-
Cellular basis of wing size variation in Drosophila melanogaster: a comparison of latitudinal clines on two continents.Heredity (Edinb). 2000 Mar;84 ( Pt 3):338-47. doi: 10.1046/j.1365-2540.2000.00677.x. Heredity (Edinb). 2000. PMID: 10762404
-
Latitudinal clines in heat tolerance, protein synthesis rate and transcript level of a candidate gene in Drosophila melanogaster.J Insect Physiol. 2014 Jan;60:136-44. doi: 10.1016/j.jinsphys.2013.12.003. Epub 2013 Dec 11. J Insect Physiol. 2014. PMID: 24333150
-
Revisiting classic clines in Drosophila melanogaster in the age of genomics.Trends Genet. 2015 Aug;31(8):434-44. doi: 10.1016/j.tig.2015.05.006. Epub 2015 Jun 10. Trends Genet. 2015. PMID: 26072452 Free PMC article. Review.
Cited by
-
Parallel and population-specific gene regulatory evolution in cold-adapted fly populations.Genetics. 2021 Jul 14;218(3):iyab077. doi: 10.1093/genetics/iyab077. Genetics. 2021. PMID: 33989401 Free PMC article.
-
Long-term evolution of quantitative traits in the Drosophila melanogaster species subgroup.Genetica. 2022 Dec;150(6):343-353. doi: 10.1007/s10709-022-00171-9. Epub 2022 Oct 15. Genetica. 2022. PMID: 36242716
-
Clinal variation in natural populations of Drosophila melanogaster: An old debate about natural selection and neutral processes.Genet Mol Biol. 2024 Jul 22;47Suppl 1(Suppl 1):e20230348. doi: 10.1590/1678-4685-GMB-2023-0348. eCollection 2024. Genet Mol Biol. 2024. PMID: 39037374 Free PMC article.
-
Natural Genetic Variation and Candidate Genes for Morphological Traits in Drosophila melanogaster.PLoS One. 2016 Jul 26;11(7):e0160069. doi: 10.1371/journal.pone.0160069. eCollection 2016. PLoS One. 2016. PMID: 27459710 Free PMC article.
-
Intermolecular Interactions Drive Protein Adaptive and Coadaptive Evolution at Both Species and Population Levels.Mol Biol Evol. 2022 Jan 7;39(1):msab350. doi: 10.1093/molbev/msab350. Mol Biol Evol. 2022. PMID: 34878126 Free PMC article.
References
-
- Adams D, Rohlf F, Slice D. Geometric morphometrics: ten years of progress following the “revolution”. Ital J Zool. 2004;71(1):5–16.
-
- Azevedo R, French V, Partridge L. Thermal evolution of egg size in Drosophila melanogaster. Evolution. 1996;50(6):2338–2345. - PubMed
-
- Bitner-Mathe B, Klaczko L. Size and shape heritability in natural populations of Drosophila mediopunctata: temporal and microgeographical variation. Genetica. 1999;105(1):35–42. - PubMed
Publication types
MeSH terms
Grants and funding
LinkOut - more resources
Full Text Sources
Other Literature Sources
Molecular Biology Databases
