. 2013 Apr;81(4):1140-51.
doi: 10.1128/IAI.00749-12. Epub 2013 Jan 28.

CD11a regulates effector CD8 T cell differentiation and central memory development in response to infection with Listeria monocytogenes

Affiliations

CD11a regulates effector CD8 T cell differentiation and central memory development in response to infection with Listeria monocytogenes

Tina O Bose et al. Infect Immun. 2013 Apr.

Abstract

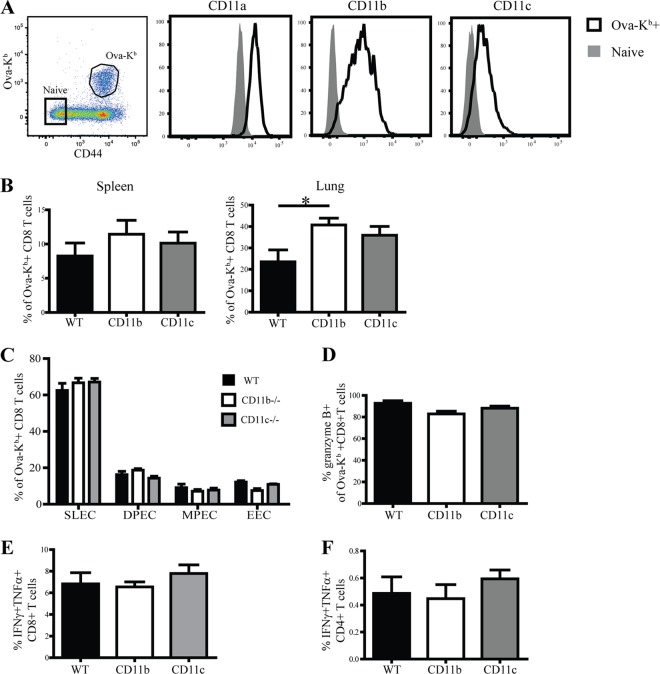
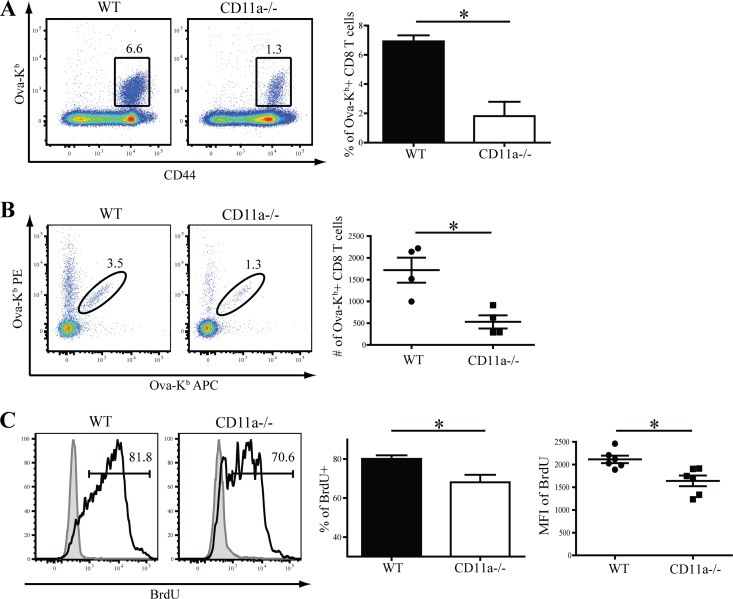
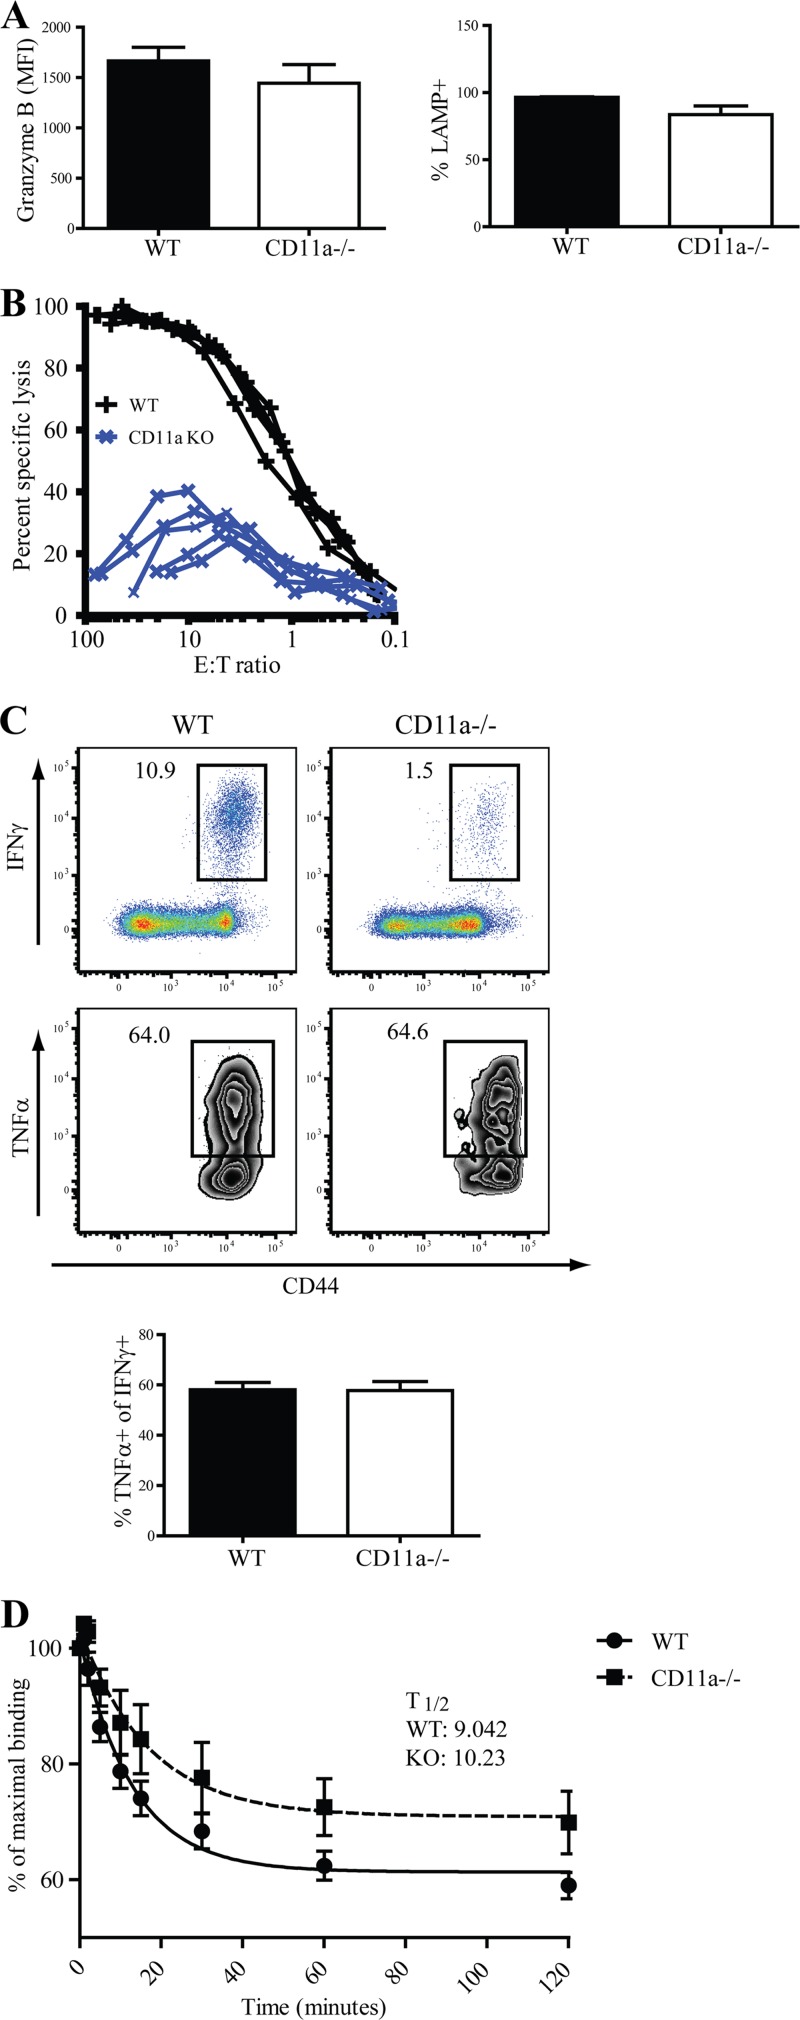
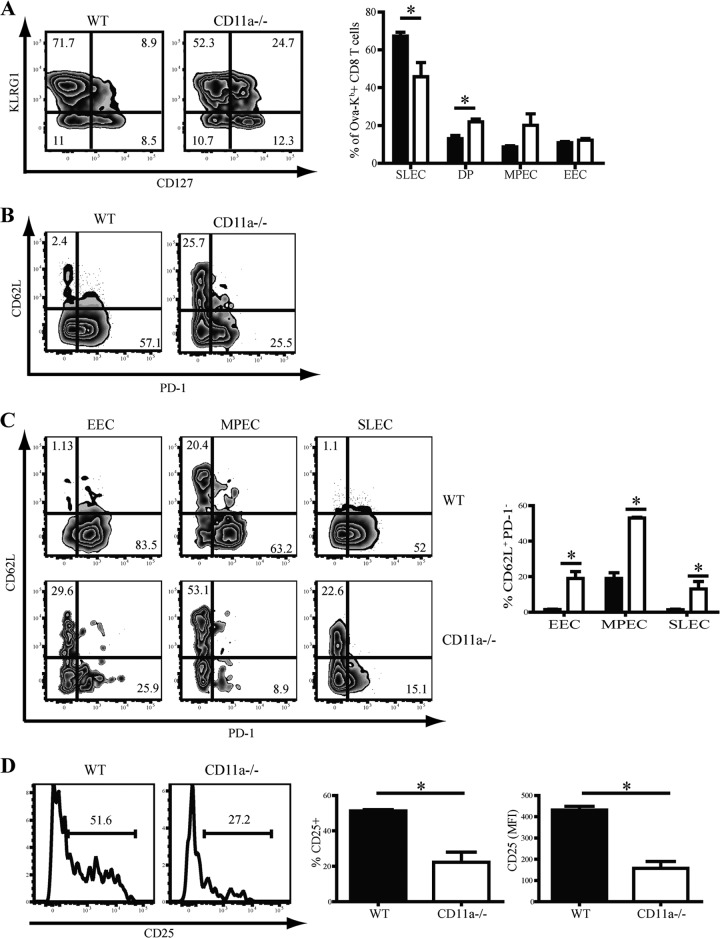
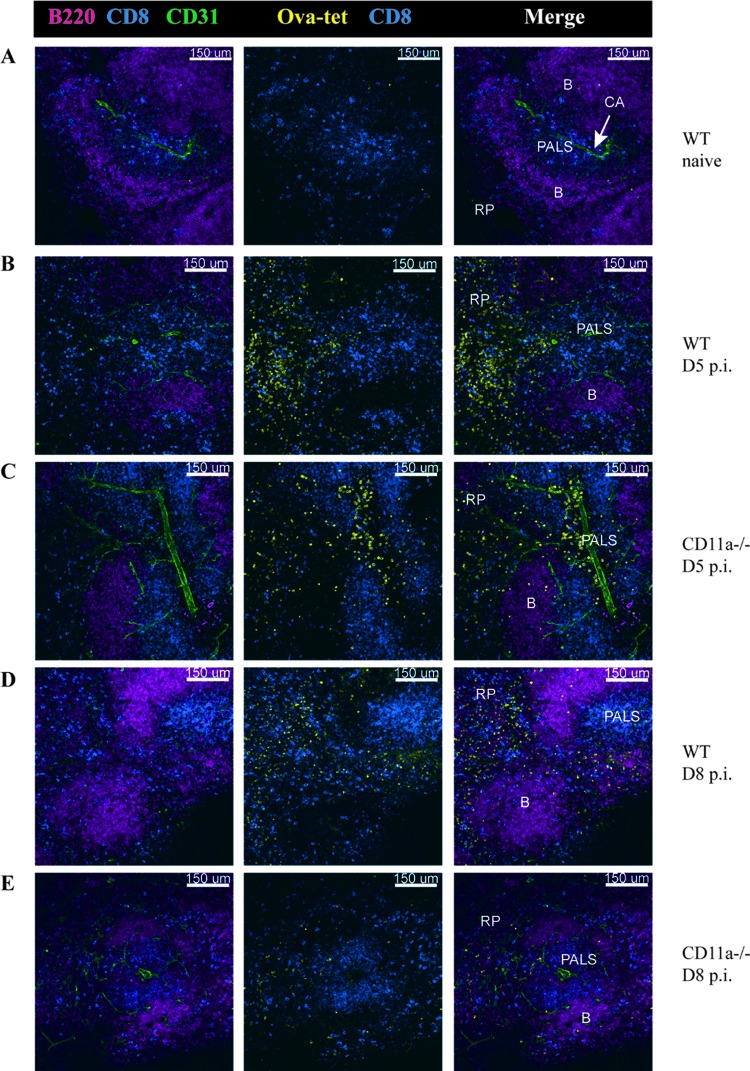
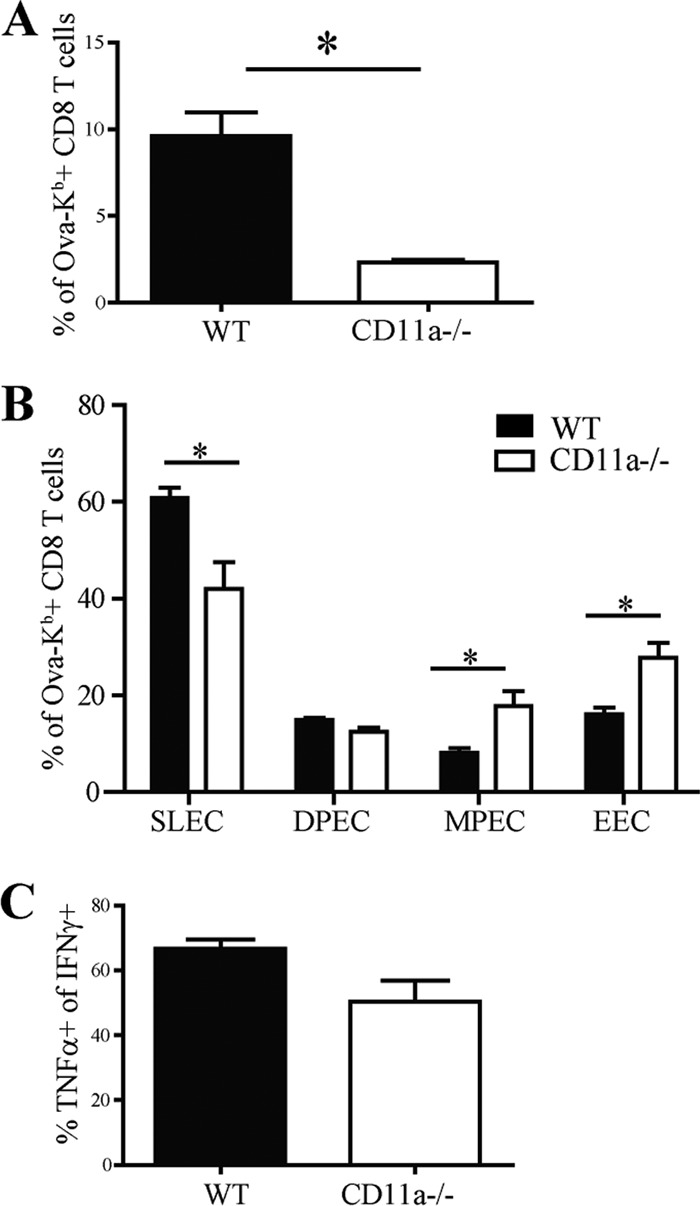
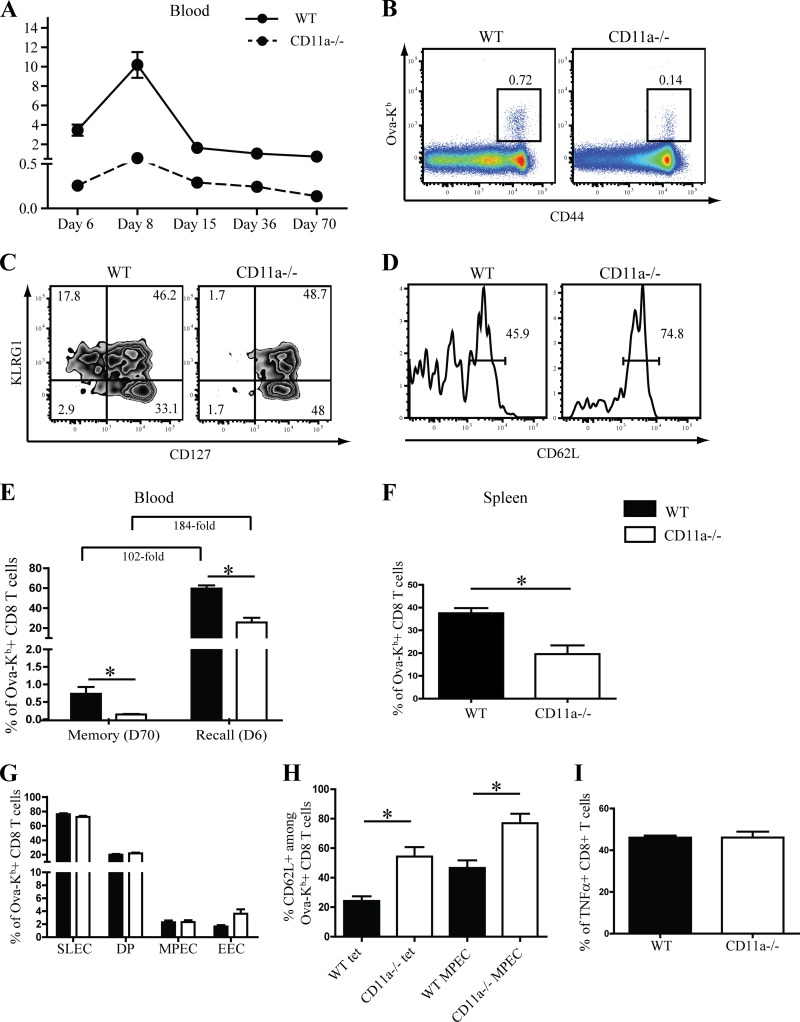
β2 (CD18) integrins with α-chains CD11a, -b, -c, and -d are important adhesion molecules necessary for leukocyte migration and cellular interactions. CD18 deficiency leads to recurrent bacterial infections and poor wound healing due to reduced migration of leukocytes to inflammatory sites. CD8 T cells also upregulate CD11a, CD11b, and CD11c upon activation. However, the role these molecules play for CD8 T cells in vivo is not known. To determine the function of individual β2 integrins, we examined CD8 T cell responses to Listeria monocytogenes infection in CD11a-, CD11b-, and CD11c-deficient mice. The absence of CD11b or CD11c had no effect on the generation of antigen-specific CD8 T cells. In contrast, the magnitude of the primary CD8 T cell response in CD11a-deficient mice was significantly reduced. Moreover, the response in CD11a(-/-) mice exhibited reduced differentiation of short-lived effector cells (KLRG1(hi) CD127(lo)), although cytokine and granzyme B production levels were unaffected. Notably, CD11a deficiency resulted in greatly enhanced generation of CD62L(+) central memory cells. Surprisingly, CD8 T cells lacking CD11a mounted a robust secondary response to infection. Taken together, these findings demonstrated that CD11a expression contributes to expansion and differentiation of primary CD8 T cells but may be dispensable for secondary responses to infection.


Figures

Fig 1
Fig 1
Absence of CD11b or CD11c does not affect priming of CD8 T cells during Listeria infection. (A) Representative plots show gated CD8 T cells from spleens of WT C57BL/6 mice that were infected 8 days prior with L. monocytogenes Ova. Histograms show expression of CD11a, CD11b, and CD11c by tetramer+ CD8 T cells and endogenous naïve CD8 T cells (tetramer CD44low). (B) Graphs show frequencies of Ova-Kb-specific CD8 T cells in WT versus CD11b−/− and CD11c−/− mice in spleen and lung at day 8 p.i. (C and D) Graphical representations of various effector subsets (C) and granzyme B production (D) of Ova-Kb-specific CD8 T cells. (E and F) Eight days p.i., splenocytes were restimulated in vitro with peptide to assess cytokine production from CD8 (E) and CD4 (F) T cells. These data are representative of two individual experiments with four to five mice per group. Statistical significance was determined using a one-way analysis of variance and Bonferroni post test. *, P < 0.05.
Fig 2
Fig 2
CD11a drives optimal proliferation of responding CD8 T cells. (A) Dot plot and graph showing the magnitude of the Ova-Kb-specific CD8 T cell response in WT and CD11a−/− mice in the spleen at day 8 p.i. (B) Data plot and graph showing the magnitude of the Ova-Kb-specific response in tetramer-enriched splenocytes from at day 4 p.i. Each representative dot plot and data point on the graph is representative of 3 pooled mice from two individual experiments. (C) Histogram analysis and graphs of BrdU incorporation among tetramer+ CD8 T cells (open histogram) or naïve (CD44low) CD8 T cells (gray filled histograms) in individual spleens at day 8 p.i. Indicated numbers on dot plots and histograms signify the percentages of cells that were within each gated region of representative samples. Data in panels A and C are representative of two or more individual experiments, which included 4 to 5 mice per group. Student's t test was used to determine statistical significance. *, P < 0.05.
Fig 3
Fig 3
Normal effector functions of responding CD8 T cells in CD11a-deficient mice. (A) Splenocytes from infected mice at day 8 were isolated and directly stained for granzyme B expression or restimulated in vitro for 5 h with SIINFEKL peptide before analysis for LAMP-1 (CD107a). Bar graphs show granzyme expression among Ova-Kb-specific CD8 T cells and LAMP expression among IFN-γ-producing CD8 T cells. (B) In vitro killing activity of CD11a−/− and WT CD8 T cells. Each line represents one mouse. (C) Representative dot plots of TNF-α producers (bottom panel and bar graph) gated on CD8 T cells producing IFN-γ (top panel) after in vitro restimulation with peptide. (D) Tetramer binding decay assay of Ova-Kb-specific CD8 T cells of day 8 p.i. splenocytes. Data are representative of combined results of two individual experiments with a total of 9 to 10 mice per group. The half-life of Ova-Kb tetramer binding (t½) was defined as the amount of time required to lose 50% of the maximal tetramer binding activity. The mean t½ is indicated for each group on the graph. Indicated numbers on the dot and zebra plots signify the percentages of cells that were within each gated region of representative samples.
Fig 4
Fig 4
CD11a regulates effector CD8 T cell differentiation. (A) KLRG1 and CD127 expression levels were used to subdivide Ova-Kb-specific CD8 T cells into EEC (KLRG1low CD127low), MPEC (KLRG1low CD127hi), DPEC (KLRG1hi CD127hi), and SLEC (KLRG1hi CD127low). (B and C) Representative zebra plots and bar graphs show CD62L versus PD-1 expression either among total Ova-Kb-specific CD8 T cells (B) or within specific effector subsets (C) in splenocytes of D8 infected mice. (D) Histogram displaying CD25 expression of antigen-specific CD8 T cells in tetramer-enriched splenocytes at day 4 from infected mice. Splenocytes from 3 mice were pooled per sample with a total of 12 mice per group. Bar graphs show frequenies and MFI values for CD25 expression in total tetramer-enriched CD8 T cells. The numbers on the zebra plots and histograms signify the percentages of cells that were within each gated region of representative samples. Data are representative of two or more experiments. Student's t test was used for statistical analysis. *, P < 0.05.
Fig 5
Fig 5
Normal localization of Ova-Kb-specific CD8 T cells in CD11a−/− mice after L. monocytogenes infection. Thick sections of spleens were stained with Ova-Kb tetramer and antibodies to other surface markers to indicate B (B220) and T cell (CD8) zones and CD31 to identify blood vessels. (A) Images of uninfected spleens from WT mice were acquired with a 20× 0.75 numerical aperture (NA) objective. (B and C) Infection with 1 × 10⁶ CFU ActA−/− L. monocytogenes Ova was used to assess the early T cell response (day 5 p.i.) in WT (B) and CD11a−/− (C) mice. (D and E) Sections from spleens of WT (D) and CD11a knockout (E) mice that had been infected with 1 × 10³ CFU L. monocytogenes Ova 8 days prior. B, B cell zone; PALS, peri-arteriolar lymphoid sheath (T cell zone); RP, red pulp; CA, central arteriole.
Fig 6
Fig 6
The CD11a requirement for CD8 T cell activation is cell intrinsic. Chimeric mice reconstituted with a mixture of bone marrow from WT and CD11a−/− mice were infected with 1 × 10³ CFU L. monocytogenes Ova and assessed for T cell responses in the spleen 8 days postinfection. Bar graphs display overall frequencies of antigen-specific T cell responses (A) and differentiation among responding cells (B). (C) Splenocytes were used for in vitro peptide restimulation to determine the frequency of cells producing TNF-α among IFN-γ+ CD8 T cells. Data are representative of two individual experiments with 4 chimeric mice per experiment.
Fig 7
Fig 7
Memory CD8 T cell reactivation is CD11a independent. (A) Graph showing the kinetics of Ova-Kb-specific CD8 T cells in the peripheral blood at various time points after infection with 1 × 10³ CFU of L. monocytogenes Ova. (B and C) Representative dot plots show staining of Ova-Kb-specific CD8 T cells (B) and KLRG1/CD127 expression (C) among Ova-Kb-specific CD8 T cells in peripheral blood 70 days postinfection. (D) CD62L expression among Ova-Kb-specific MPEC (KLRG1low CD127hi) at day 70 in the peripheral blood. (E) Memory mice were challenged with 1 × 10⁴ CFU of L. monocytogenes Ova, and recall responses were assessed in the blood before and after recall. (F to I) Splenocytes were harvested 6 days postrecall to determine the frequency of Ova-specific CD8 T cells (F) or SLEC/MPEC differentiation of antigen-specific CD8 T cells (G). (H) Bar graphs represent CD62L expression in total Ova-Kb-specific CD8 T cells or among the MPEC population. (I) In vitro restimulation of recalled splenocytes was used to assess the frequency of TNF-α producers (gated first on CD8 T cells producing IFN-γ). Numbers on dot plots and histograms signify percentages of cells that were within each gated region of representative samples. These data are representative of two individual experiments with a total of 5 mice per group.

References

    1. McFarland HI, Nahill SR, Maciaszek JW, Welsh RM. 1992. CD11b(Mac-1): a marker for CD8+ cytotoxic T cell activation and memory in virus infection. J. Immunol. 149:1326–1333 - PubMed
    1. Huleatt JW, Lefrançois L. 1995. Antigen-driven induction of CD11c on intestinal intraepithelial lymphocytes and CD8(+) T cells in vivo. J. Immunol. 154:5684–5693 - PubMed
    1. Hynes RO. 1992. Integrins: versatility, modulation, and signaling in cell adhesion. Cell 69:11–25 - PubMed
    1. Anderson DC, Springer TA. 1987. Leukocyte adhesion deficiency: an inherited defect in the Mac-1, LFA-1, and p150,95 glycoproteins. Annu. Rev. Med. 38:175–194 - PubMed
    1. Hogg N, Bates PA. 2000. Genetic analysis of integrin function in man: LAD-1 and other syndromes. Matrix Biol. 19:211–222 - PubMed

Publication types