. 2013 May;23(5):620-34.
doi: 10.1038/cr.2013.16. Epub 2013 Jan 29.

Def defines a conserved nucleolar pathway that leads p53 to proteasome-independent degradation

Affiliations

Def defines a conserved nucleolar pathway that leads p53 to proteasome-independent degradation

Ting Tao et al. Cell Res. 2013 May.

Abstract

p53 protein turnover through the ubiquitination pathway is a vital mechanism in the regulation of its transcriptional activity; however, little is known about p53 turnover through proteasome-independent pathway(s). The digestive organ expansion factor (Def) protein is essential for the development of digestive organs. In zebrafish, loss of function of def selectively upregulates the expression of p53 response genes, which raises a question as to what is the relationship between Def and p53. We report here that Def is a nucleolar protein and that loss of function of def leads to the upregulation of p53 protein, which surprisingly accumulates in the nucleoli. Our extensive studies have demonstrated that Def can mediate the degradation of p53 protein and that this process is independent of the proteasome pathway, but dependent on the activity of Calpain3, a cysteine protease. Our findings define a novel nucleolar pathway that regulates the turnover function of p53, which will advance our understanding of p53's role in organogenesis and tumorigenesis.


Figures

Figure 1
Figure 1
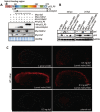
Def selectively induced the degradation of p53 and Δ113p53 proteins. (A) Western blot of p53 and Δ113p53 using the A7-C10 monoclonal antibody to detect both proteins in defhi429 homozygotes and non-homozygous siblings at 5 dpf and in γ-ray-treated wild-type embryos. ?, uncharacterized p53 isoforms; β-actin, loading control. (B) Coimmunostaining of Fib and p53/Δ113p53 in a defhi429 mutant embryo injected with st-MO (upper panel), Δ113p53-MO (middle panel) or p53-MOATG (bottom panel) morpholinos at 4 dpf. Nuclei were stained with DAPI. st-MO: standard control morpholino. in: intestine. (C) Western blot (top three panels) of p53 protein and northern blot (bottom two panels) of p53 mRNA in embryos injected with different mRNA mixes at 6 hpi as shown. 28S rRNA: RNA loading control. GAPDH, protein loading control. (D) Same as in (C), but analysis of Δ113p53. (E) Same as in (C), but analysis of EGFP. (F) tp53M214K mutant embryos were injected with different mRNA mixes or phenol red dye. The survival rate of embryos in each treatment group at 12 hpi was analyzed. The values plotted represent mean ± SEM (three repeats of n = 100-200 embryos each), with test P-values indicated. (G) Analysis of apoptosis in embryos described in (F) at 10 hpi. Embryos were categorized based on their number of apoptotic cells. Category 1, < 50 apoptotic cells per embryo; category 2, between 50-300 apoptotic cells per embryo; category 3, > than 300 apoptotic cells per embryo. Graphics shows the number of embryos in each category in each case. (H) qPCR analysis of p53 target genes in embryos described in (F). The qPCR values were normalized against elf1a and expressed as fold change in expression. The values plotted represent mean ± SEM. The P-value was obtained by performing the two-tailed unpaired t-test. ***P < 0.001; **P < 0.01.
Figure 2
Figure 2
Def-mediated p53 degradation was independent of Mdm2. (A) Diagram on the top shows the Mdm2-binding domain and other key functional domains of the p53 protein, and shows the truncated sites for Δ113p53 and p53-P5. TAD, transactivation domain; PRR, proline-rich region; DBD, DNA-binding domain; TET, tetramerization domain; CT, C-terminus regulation domain. Numerical numbers denote the amino acid position from Met. Western blot analysis of p53, Def and Mdm2 examined the effects of Def and Mdm2 on the stability of Δ113p53 and p53-P5 proteins at 6 hpi. Commassie Blue staining, protein loading control. (B, C) Western blot of p53 and Def for analyzing the effect of Def on endogenous p53 induced by mdm2-MO at 10 hpi and 24 hpi, respectively (B). TUNEL assay for analysis of apoptosis in embryos injected with mdm2-MO alone or mdm2-MO+def mRNA mix at 24 hpi (C). st-MO morpholino, defstop mRNA and phenol red dye injections were used as the controls.
Figure 3
Figure 3
Def-mediated p53 degradation is independent of the ubiquitination pathway. (A) Diagram shows the structure of p53 protein (refer to Figure 2A) and six p53 deletion mutant constructs. (B) Western blot of p53, six p53 deletion mutant products and Def for analyzing the effect of Def on their stability in the co-injected embryos at 6 hpi. (C) Same as in (B) but analyzing the effect of Mdm2. (D) Western blot of p53, Def and Mdm2 for comparing the effect of Def and Mdm2 on the stability of p53 mutant proteins R143H, R250W and R313C in the injected embryos at 6 hpi. (E) Western blot of p53 for comparing the effect of different dosages of ubiquitin on the stability of p53 in the injected embryos at 6 hpi. (F) Western blot of p53 and Mdm2 for analyzing the effect of Mdm2 plus ubiquitin on the stability of p53 mutant protein p53-9KR in the injected embryos at 6 hpi. (G) Same as in (F) but analyzing the effect of Def.
Figure 4
Figure 4
Def-mediated p53 degradation was inhibited by the cysteine protease inhibitor. (A) Sequencing genomic DNA from different human cells identified two SNPs (G/C at codon position ORF199, A/G at codon position ORF332) in the hu-Def coding region. (B) Western blot of p53, Def, Hdm2, p21 and Bax for comparing the effect of hu-Def encoded by four combinations of (G/C)199 and (A/G)332 SNPs on the stability of p53 in MCF-7 cells co-transfected with MYC-tagged p53 plasmid, and the expression of p53 target genes p21 and Bax at 24 hpt. (C) Same as in (B) but analysis of Δ133p53 in co-transfected cells. (D) Western blot of p53 and Def in MCF-7, HepG2 or Ovcar-8/TR cells treated with def specific siRNA pool (hu-def-siRNA pool) at 24 hpt. (E) Western blot of p53 and Def for comparing the effect of various inhibitors on hu-Def-mediated p53 degradation. (F) Same as in (E) but analysis of the effect of selected inhibitors on Hdm2-mediated p53 degradation. In (D-F), fold changes in expression for p53 or hu-Def against their respective controls (set as 1) are shown under their corresponding panels. GAPDH or β-actin was used as the normalization control.
Figure 5
Figure 5
Def-mediated p53 degradation depends on cysteine protease, CAPN3. (A) Western blot of p53 and Def for comparing the effect of knockdown of CAPN3, -6, -7 and -8 by their specific siRNAs on hu-Def-mediated p53 degradation. (B) qPCR showing the efficiency of knockdown of capn6, capn7 and capn8 by their respective siRNAs. The relative expression level of the genes was shown in fold change as normalized against human elf1a. (C) Western blot of p53, Def, Hdm2 and CAPN3 in MCF-7 cells treated with CAPN3-siRNA. (D) Western blot of p53 and CAPN3 in CAPN3-siRNA treated MCF-7 and HepG2 cells at 24 hpt. (E) Western blot of p53, CAPN3 and Def in cells transfected with CAPN3, p53 overexpression plasmids and hu-Def siRNA. (F) Co-IP analysis of interaction between hu-Def and CAPN3 in H1299 cells. Cells were transfected with plasmids as indicated. In (A, and C-E), fold changes in expression for p53, hu-Def or CAPN3 against their respective controls (set as 1) are shown under their corresponding panels. GAPDH was used as the normalization control.
Figure 6
Figure 6
CAPN3 knockdown activated p53 response. (A, B) Western blot analysis of the effect of RPL5 or RPL11 knockdown on the stabilized p53 induced by Def (A) or CAPN3 (B) knockdown. Fold changes in expression for p53, hu-Def or CAPN3 against their respective controls (set as 1) are shown under their corresponding panels. GAPDH was used as the normalization control. (C) qPCR analysis of expression of p53 response genes in HepG2 or H1299 cells treated with control siRNA (ctrl-siRNA) or capn3-siRNA. The relative expression level of the genes is shown in fold change as normalized against human elf1a. (D) FACS analysis of the ratio of cells at G2/M, S and G1 phases (histogram on the left) after cells were treated with ctrl-siRNA (middle graph) or capn3-siRNA (graph on the right). (E) Analysis of apoptotic cells (histogram on the left) after Annexin V staining on cells treated with ctrl-siRNA (middle graph) or capn3-siRNA (graph on the right).
Figure 7
Figure 7
Def and CAPN3 duet in zebrafish. (A) WISH analysis of the expression patterns of capn3a and capn3b in embryos at 2 and 4 dpf, respectively, using capn3a or capn3b probes. en, endoderm tube; in, intestine; le, lens; lv, liver. (B) Western blot of p53, Def and Mdm2 for comparing the effect of knockdown of zebrafish Capn3a or Capn3b with their specific morpholinos capn3a-MO or capn3b-MO on Def-mediated or Mdm2-mediated p53 degradation in the injected embryos at 6 hpi. (C) Western blot of the endogenous p53 in capn3a-MO, capn3b-MO and def-MO morphants at 3 dpi. (D) Western blot of p53 for examining the effect of capn3b mRNA lacking the capn3b-MO target sequence (Myc-capn3b-5mu) or the mutant mRNA carrying a mutation changing the codon for the active site Cys120 to Ser120 (Myc-capn3bC120S-5mu) on elevated endogenous p53 induced by capn3b-MO. Capn3b was detected using a polyclonal antibody against zebrafish Capn3b. Myc-Capn3b, Myc-tagged Capn3b; endo-Capn3b, endogenous Capn3b. (E) qPCR analysis of capn3a and capn3b transcripts in defhi429 mutant embryos and wild-type controls (WT). The relative expression level of the genes was shown in fold change as normalized against zebrafish elf1. (F) Western blot analysis of p53, Δ113p53, Def and CAPN3 (α-Myc) in the embryos co-injected with def-MO morphlino plus capn3a mRNA or def-MO morpholino plus capn3b mRNA at 3 dpi. Wild-type embryos (CK) and st-MO-injected embryos were used as the controls. (G) Graphics summarizes the roles of the nucleolus in regulation of p53 homeostasis. In response to stress conditions such as nucleolar disruption, oncogene activation, DNA damage or developmental defect, p53 is stabilized or activated. Nucleolar factors including Arf, PML, RPL5 and RPL11 can associate with Mdm2 to prevent p53 ubiquitination and degradation through the 26S proteasome in the nucleoplasm and cytoplasm. In contrast, the role of the Def-CAPN3 pathway is to prevent the accumulation of p53 in the nucleolus by triggering in situ p53 degradation.

Comment in

  • Proteasome-independent p53 degradation.
    Nuaaman MM, Benchimol S. Nuaaman MM, et al. Cell Res. 2013 May;23(5):597-8. doi: 10.1038/cr.2013.38. Epub 2013 Mar 12. Cell Res. 2013. PMID: 23478295 Free PMC article.

Similar articles

Cited by

References

    1. Levine AJ, Hu W, Feng Z. The P53 pathway: what questions remain to be explored. Cell Death Differ. 2006;13:1027–1036. - PubMed
    1. Tai E, Benchimol S. TRIMming p53 for ubiquitination. Proc Natl Acad Sci USA. 2009;106:11431–11432. - PMC - PubMed
    1. Tsvetkov P, Reuven N, Shaul Y. Ubiquitin-independent p53 proteasomal degradation. Cell Death Differ. 2010;17:103–108. - PubMed
    1. Pariat M, Carillo S, Molinari M, et al. Proteolysis by calpains: a possible contribution to degradation of p53. Mol Cell Biol. 1997;17:2806–2815. - PMC - PubMed
    1. Kubbutat MH, Vousden KH. Proteolytic cleavage of human p53 by calpain: a potential regulator of protein stability. Mol Cell Biol. 1997;17:460–468. - PMC - PubMed

Publication types

MeSH terms

Substances