. 2013 Jan;9(1):e1003124.
doi: 10.1371/journal.ppat.1003124. Epub 2013 Jan 24.

IFITM proteins restrict viral membrane hemifusion

Affiliations

IFITM proteins restrict viral membrane hemifusion

Kun Li et al. PLoS Pathog. 2013 Jan.

Abstract

The interferon-inducible transmembrane (IFITM) protein family represents a new class of cellular restriction factors that block early stages of viral replication; the underlying mechanism is currently not known. Here we provide evidence that IFITM proteins restrict membrane fusion induced by representatives of all three classes of viral membrane fusion proteins. IFITM1 profoundly suppressed syncytia formation and cell-cell fusion induced by almost all viral fusion proteins examined; IFITM2 and IFITM3 also strongly inhibited their fusion, with efficiency somewhat dependent on cell types. Furthermore, treatment of cells with IFN also markedly inhibited viral membrane fusion and entry. By using the Jaagsiekte sheep retrovirus envelope and influenza A virus hemagglutinin as models for study, we showed that IFITM-mediated restriction on membrane fusion is not at the steps of receptor- and/or low pH-mediated triggering; instead, the creation of hemifusion was essentially blocked by IFITMs. Chlorpromazine (CPZ), a chemical known to promote the transition from hemifusion to full fusion, was unable to rescue the IFITM-mediated restriction on fusion. In contrast, oleic acid (OA), a lipid analog that generates negative spontaneous curvature and thereby promotes hemifusion, virtually overcame the restriction. To explore the possible effect of IFITM proteins on membrane molecular order and fluidity, we performed fluorescence labeling with Laurdan, in conjunction with two-photon laser scanning and fluorescence-lifetime imaging microscopy (FLIM). We observed that the generalized polarizations (GPs) and fluorescence lifetimes of cell membranes expressing IFITM proteins were greatly enhanced, indicating higher molecularly ordered and less fluidized membranes. Collectively, our data demonstrated that IFITM proteins suppress viral membrane fusion before the creation of hemifusion, and suggested that they may do so by reducing membrane fluidity and conferring a positive spontaneous curvature in the outer leaflets of cell membranes. Our study provides novel insight into the understanding of how IFITM protein family restricts viral membrane fusion and infection.


Conflict of interest statement

The authors have declared that no competing interests exist.

Figures
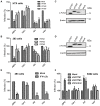
Figure 1
Figure 1. IFITM proteins differentially restrict JSRV, 10A1 MLV, IAV and VSV entry.
(A) HTX cells stably expressing IFITM1, 2 or 3 were infected with indicated MLV pseudovirions encoding alkaline phosphatase (AP). Three days after infection, the infected cells were fixed and stained for AP activity. Foci of AP-positive cells were counted and normalized to those of parental HTX cells infected with same amounts of pseudovirions (Mock). (B) 293 cells stably expressing IFITM1, 2 or 3 were infected with MLV-GFP pseudovirions bearing indicated viral glycoproteins. Two days after infection, the pseudovirus infectivity was determined by flow cytometry; the percents of infection were normalized to those of mock controls. (C, D) Immunoblotting of cell lysates harvested from the HTX (C) and 293 (D) cells employed in experiments shown in (A) and (B). Anti-FLAG and anti-β-actin were used as primary antibodies to detect IFITMs and β-actin, respectively. (E) 293 cells were treated with 500 units of IFN-α2b for 24 h, and infected with indicated MLV-GFP pseudovirions. The viral infectivity was normalized to that of cells in absence of the IFN-α2b treatment. (F) K562 cells stably expressing control shRNA or shRNA targeting IFITM1 or 3 were infected with MLV-GFP pseudovirions bearing indicated viral glycoproteins. The infectivity was measured by flow cytometry and normalized to that of parental K562 cells (Mock) infected with same amounts of indicated pseudovirions. Typically, an MOI of 0.05–0.2 were used for all GFP pseudovirion infections. In all cases, averages ± SD of at least three independent experiments are shown; * denotes p<0.05; ** denotes p<0.01.
Figure 2
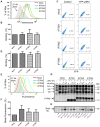
Figure 2. Expression of IFITM proteins does not affect binding of JSRV Env to cells expressing the Hyal2 receptor, nor does it perturb receptor-mediated priming for fusion activation.
(A) Examination of JSRV Env binding to cells expressing IFITMs. HTX cells stably expressing indicated IFITM proteins were incubated with purified JSRV SU-human IgG Fc proteins at 4°C; following incubation with FITC conjugated anti-human Fc antibody, cells were analyzed by flow cytometry. Representative histograms from one typical experiment are shown. Arrow indicates the secondary antibody alone control. (B) Quantitative analysis of JSRV Env binding data shown in (A). The fluorescence intensities (geometric means) obtained from (A) were averaged and normalized to those of mock controls. The means ± SD of at least three independent experiments are shown. (C) Examination of the JSRV pseudovirion binding to cells expressing IFITMs. HTX cells expressing IFITM proteins were incubated with purified JSRV pseudovirions containing MLV Gag-YFP to allow virus binding. Cells were washed, fixed and analyzed by flow cytometry. “Control” indicates cells incubated with MLV Gag-YFP pseudovirions in the absence of JSRV Env. Representative flow cytometry profiles are shown. (D) Quantitative analysis of the JSRV pseudovirion binding experiments shown in (C). The fluorescence intensities of three independent experiments were averaged and plotted. (E) Expression of IFITM proteins on the surface of HTX cells. The expression was examined by an anti-FLAG antibody and analyzed by flow cytometry. (F) Quantitative analysis of IFITM expression on the cell surface shown in (E). Values are the means ± SD of at least five independent experiments. (G and H) Examination of the effect of IFITMs on JSRV SU shedding. 293T cells were co-transfected with plasmids encoding FLAG tagged-JSRV Env and FLAG-tagged IFITMs. Cells were metabolically labeled and chased in the presence of indicated amounts of sHyal2. Cell lysates and culture media were harvested and immunoprecipitated with anti-FLAG beads. Samples were resolved by SDS-PAGE and subjected to autoradiograthy. (G) Expression of JSRV Env and IFITM in transfected cells. Env: the full length of JSRV Env; SU: surface subunit; TM: transmembrane subunit. (H) Shedding of JSRV SU into culture medium. Note the increased SU shedding in cells expressing JSRV Env with increasing amounts of sHyal2; no significant differences in shedding among cells expressing IFITM and mock controls were observed. The relative intensities of signals for shed SU were calculated by setting the signals of the mock control without sHyal2 stimulation as 1.0; three independent experiments were used for the quantification.
Figure 3
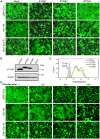
Figure 3. Expression of IFITM proteins or treatment of cells with IFN suppresses syncytia formation induced by JSRV Env and IAV HA.
(A) 293/LH2SN cells stably expressing the indicated IFITM proteins were transfected with plasmid DNA encoding JSRV Env, IAV HA or 10A1 MLV Env with the R peptide deleted (10A1 Env R); cells were treated with a pH 5.0 buffer for 1 min (for JSRV Env and IAV HA) or left untreated (for 10A1 MLV Env) and analyzed for syncytium formation using fluorescence microscopy. Note the stronger inhibition of IFITM1 relative to that of IFITM2 and 3 for JSRV Env and IAV HA; no apparent inhibition was observed for 10A1 MLV Env. (B) Expression of IFITM proteins in 293/LH2SN cells was determined by immunoblotting with an anti-FLAG antibody. β-actin was used as a loading control. (C) Expression of IFITM proteins does not downregulate the JSRV Env expression on the cell surface. 293T cells were co-transfected with plasmid DNAs encoding FLAG-tagged JSRV Env (at both the N- and C-termini) plus indicated wildtype IFITMs. Cells were incubated with an anti-FLAG antibody on ice, and the surface expression of JSRV SU was determined by flow cytometry. A second antibody alone was used control. (D) 293/LH2SN cells were transfected with plasmids encoding JSRV Env, IAV HA, or 10A1 MLV Env with the R peptide deleted; 6 h after transfection, cells were treated with indicated amounts of IFN-α2b or medium for 24 h. Cells were exposed to a pH 5.0 buffer for 1 min (for JSRV Env and IAV HA) or left untreated and examined for syncytia formation.
Figure 4
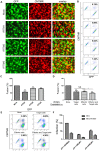
Figure 4. Cell-cell fusion induced by JSRV Env is inhibited by IFITM proteins, and extracellular low pH pulse cannot overcome IFITM1-mediated restriction on JSRV entry.
Effector 293T/GFP (green) cells were transfected with a plasmid encoding JSRV Env. The next day, cells were co-cultured with CMTMR (red)-labeled HTX/LH2SN cells stably expressing indicated IFITM proteins. Co-cultured cells were then treated with a pH 5.0 buffer for 1 min, and cell-cell fusion was examined by fluorescence microscopy (A) and flow cytometry (B). Values shown in the upper-right quadrant of flow cytometry profiles represent percentages of fused cells. (C) Percentages of fused cells in HTX/LH2SN cells expressing IFITMs were normalized to those of mock controls. Values are the means ± SD of at least three independent experiments. (D and E) Effector 293T/GFP cells were transfected with a JSRV Env-encoding plasmid alone (columns 1 and 2) or plasmids encoding JSRV Env plus IFITM1 (columns 3 and 4); 24 h post-transfection, cells were co-cultured with CMTMR-labeled target cells, either parental HTX/LH2SN (columns 1 and 3, Mock) or HTX/LH2SN stably expressing IFITM1 (columns 2 and 4). Percents of fused cells were measured by flow cytometry (E), averaged, and normalized to those of controls (column 1) (D). Values are the means ± SD of at least three independent experiments. * p<0.05; ** indicates p<0.01. NS: not statistically significant (p>0.05). (F) Low pH does not overcome IFITM1-mediated block of JSRV entry. HTX or HTX cells expressing IFITM1 were pretreated with 20 nM BafA1 (middle and right columns) or with 0.01% DMSO (left columns, as controls) for 2 h and then spininoculated with JSRV pseudovirions at 4°C for 1 h. Cells were washed with cold PBS to remove unbound viruses before incubation at 37°C for 1 h to allow endocytosis (see references 33 and 34). Cells were then treated with either a pH 7.5 or pH 5.0 buffer at 37°C for 5–10 min, followed by an additional incubation with 0.01% DMSO or 20 nM BafA1 for 4 h to allow infection. Three days after infection, viral titers were determined by counting AP-positive foci, and relative infectivity was calculated by normalizing all titers relative to those in parental HTX cells treated with DMSO. Values are the means ± standard deviations of three independent experiments.
Figure 5
Figure 5. IFITM proteins inhibit cell-cell fusion induced by representatives of three classes of viral fusion proteins.
(A to E) Effector cells expressing indicated viral fusion proteins were loaded with calcein-AM, and were bound to target 293/LH2SN cells (Mock) or to cells expressing indicated IFITM proteins that were prelabeled by CMAC. pH was then lowered to 5.0 for JSRV Env, 4.8 for IAV HA, 5.7 for VSV G, and 5.4 for SFV E1/E2. Following reneutralization of cells to 7.2, fusion between pairs of effector and target cells was scored under fluorescence microscopy. (A) IAV HA (a class I fusion protein). (B) VSV G (class III). (C) SFV E1/E2 (class II). (D) JSRV Env (class I), with COS7 as effector cells. (E) JSRV Env, with 293T cells as effector cells. Note distinct effects of IFITM3 on JSRV fusion shown in (D) and (E). (F) Restriction of JSRV and IAV entry by IFITM proteins in COS7/LH2SN cells. COS7/LH2SN cells (Mock) or derivatives expressing indicated IFITM proteins were infected with GFP-encoding MoMLV pseudovirions bearing JSRV Env or IAV HA/NA, and viral infectivity was determined by flow cytometry as described in Fig. 1. Note that IFITM3 inhibited JSRV entry as effectively as did the IFITM1; representative flow cytometry profiles are shown in Fig. S4A.
Figure 6
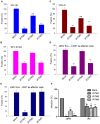
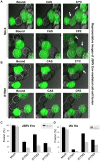
Figure 6. CPZ does not rescue the restriction of IFITMs on cell-cell fusion of viral fusion proteins.
COS7 cells expressing JSRV Env or HAB2 cells expressing IAV HA (images not shown) were loaded with calcein-AM (green) and bound to target cells (unlabeled), either parental 293/LH2SN (Mock) or derivatives expressing IFITM1 (IFITM1). Cells were treated with a pH 5.0 buffer at 4°C for 1 min to create a cold arrested state (CAS), at which aqueous dye had not transferred. Cells were then switched to 37°C or treated with CPZ, cell-cell fusion were monitored under a fluorescence microscope. (A) In mock cells (JSRV Env-mediated fusion): Upon raising temperature from the 4°C of CAS to 37°C, the two target cells of the image became labeled by calcein-AM (arrows), illustrating that fusion was now extensive. Similarly, adding CPZ to cells at CAS also led two target cells receiving calcein-AM, illustrating that fusion was as extensive upon addition of CPZ as upon raising temperature. (B) In IFITM1-expressing cells (JSRV Env-mediated fusion): Raising temperature led to calcein transfer to only one (arrow) of the four target cells. Addition of CPZ did not lead to calcein-AM transfer to any of the three target cells. (C–D) The quantifications of these phenomena are presented in JSRV Env (C) and for IAV HA (D). Similar experimental procedures were applied to IFITM2 and 3-expressing cells, and the data were plotted as show in (C) and (D).
Figure 7
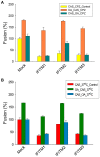
Figure 7. Making spontaneous curvature more negative prior to creating CAS promotes JSRV Env-mediated hemifusion.
CAS was created as described in Fig. 6. OA was added prior or subsequent to CAS (see details in Materials and Methods). The addition of OA before creating CAS (middle columns of groups of three) promoted aqueous dye transfer upon either addition of CPZ (A) or raising temperature to 37°C from CAS (B). In contrast, adding OA after creating CAS (third columns), did not affect the extents of dye transfer caused by either CPZ addition or by raising temperature as compared to control (first columns). This was the general pattern, independent of whether target cells contained indicated IFITM proteins or not (Mock).
Figure 8
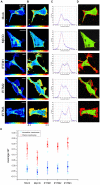
Figure 8. Expression of IFITM proteins increases the lipid order of cell membranes.
293/LH2SN cells stably expressing IFITM1, 2 or 3, or mock controls were incubated with 1.8 µM Laurdan for 40 min at 37°C, and were imaged using two-photon fluorescence microscope. Parental 293/LH2SN cells were treated with 10 mM MβCD for 1 h to serve as controls. (A) Fluorescence intensity images. The fluorescence signal was acquired from 416 nm to 474 nm for the blue channel and from 474 nm to 532 nm for the green channel. (B) Generalized polarization (GP) images. The GP image was generated according to the GP function which is a normalized ratio between the blue and the green channels (GP scale from −1 to +1). According to the calculated GP values, we restricted the GP scale from −0.3 to 0.5. (C) GP histograms. The GP histogram was fitted using two Gaussian distributions. The lower GP values are associated with internal membranes, and the higher GP values are associated with plasma membranes. (D) Pseudo-colored GP images. The lower and higher GP distributions were pseudo-colored in green and red, respectively. (E) Averaged GP values. The GP values of individual cell lines were averaged and plotted; for each cell lines, a total of 12–18 images were used for statistical analysis. Significant differences were observed between mock control and IFITM1 (p = 0.00672), IFITM3 (p = 0.00107) in the plasma membrane. See text for details.

Similar articles

Cited by

References

    1. Sadler AJ, Williams BR (2008) Interferon-inducible antiviral effectors. Nat Rev Immunol 8: 559–568. - PMC - PubMed
    1. Sheehy AM, Gaddis NC, Choi JD, Malim MH (2002) Isolation of a human gene that inhibits HIV-1 infection and is suppressed by the viral Vif protein. Nature 418: 646–650. - PubMed
    1. Neil SJ, Zang T, Bieniasz PD (2008) Tetherin inhibits retrovirus release and is antagonized by HIV-1 Vpu. Nature 451: 425–430. - PubMed
    1. Stremlau M, Owens CM, Perron MJ, Kiessling M, Autissier P, et al. (2004) The cytoplasmic body component TRIM5alpha restricts HIV-1 infection in Old World monkeys. Nature 427: 848–853. - PubMed
    1. Van Damme N, Goff D, Katsura C, Jorgenson RL, Mitchell R, et al. (2008) The interferon-induced protein BST-2 restricts HIV-1 release and is downregulated from the cell surface by the viral Vpu protein. Cell Host Microbe 3: 245–252. - PMC - PubMed

Publication types

Substances