. 2013 May;230(1):107-17.
doi: 10.1002/path.4172. Epub 2013 Mar 21.

Imbalance of desmoplastic stromal cell numbers drives aggressive cancer processes

Affiliations

Imbalance of desmoplastic stromal cell numbers drives aggressive cancer processes

Raghu Kadaba et al. J Pathol. 2013 May.

Abstract

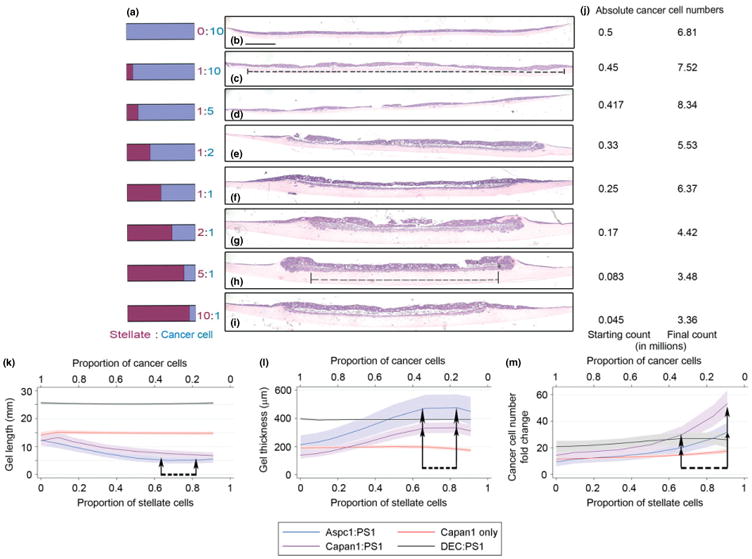
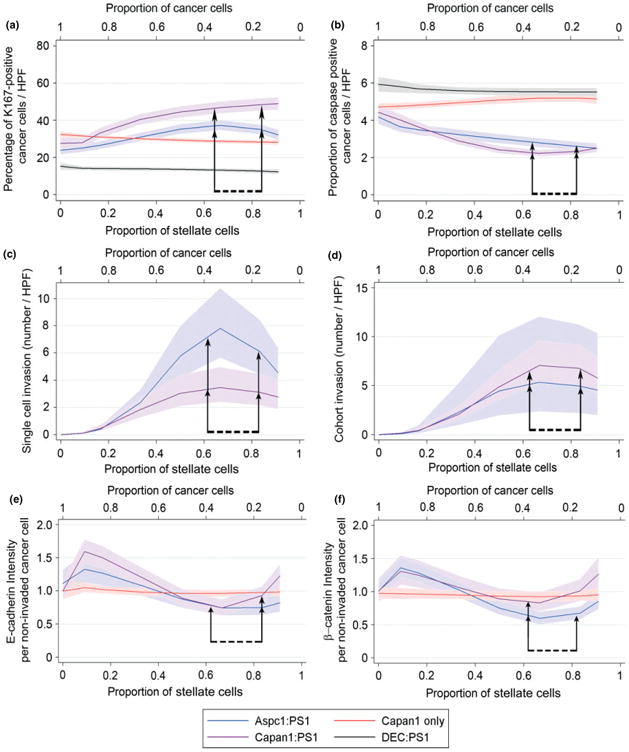
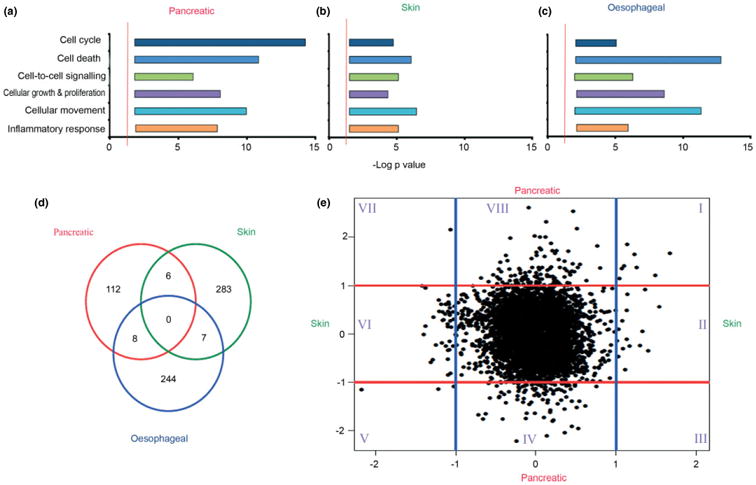
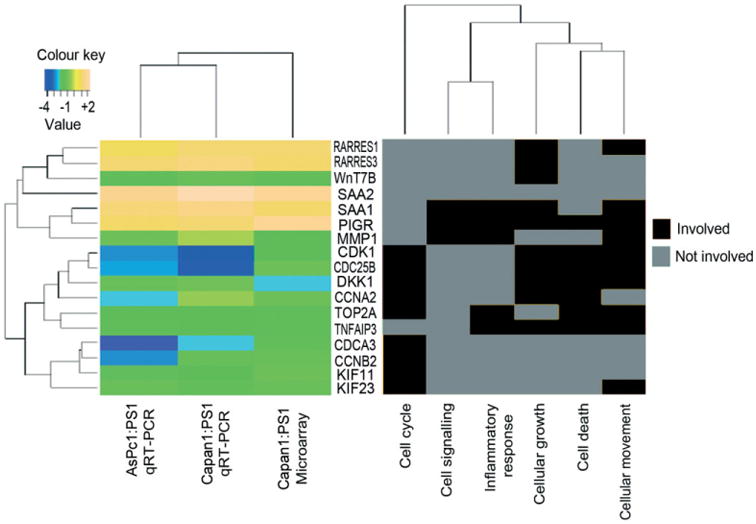
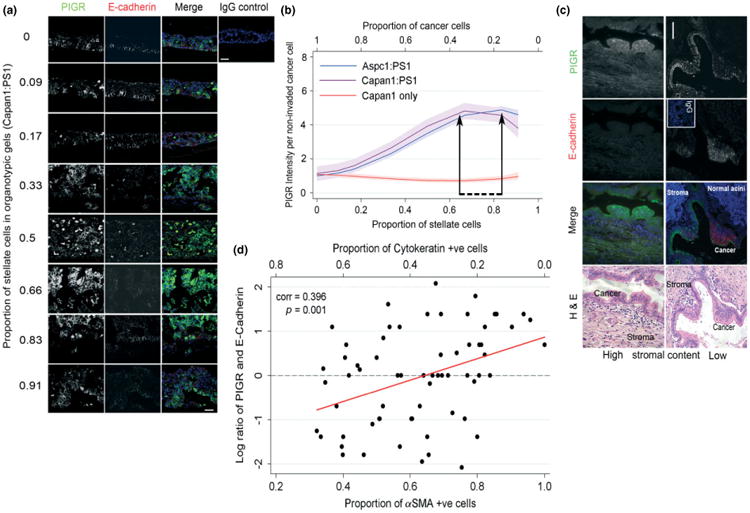
Epithelial tissues have sparse stroma, in contrast to their corresponding tumours. The effect of cancer cells on stromal cells is well recognized. Increasingly, stromal components, such as endothelial and immune cells, are considered indispensable for cancer progression. The role of desmoplastic stroma, in contrast, is poorly understood. Targeting such cellular components within the tumour is attractive. Recent evidence strongly points towards a dynamic stromal cell participation in cancer progression that impacts patient prognosis. The role of specific desmoplastic stromal cells, such as stellate cells and myofibroblasts in pancreatic, oesophageal and skin cancers, was studied in bio-engineered, physiomimetic organotypic cultures and by regression analysis. For pancreatic cancer, the maximal effect on increasing cancer cell proliferation and invasion, as well as decreasing cancer cell apoptosis, occurs when stromal (pancreatic stellate cells) cells constitute the majority of the cellular population (maximal effect at a stromal cell proportion of 0.66-0.83), accompanied by change in expression of key molecules such as E-cadherin and β-catenin. Gene-expression microarrays, across three tumour types, indicate that stromal cells consistently and significantly alter global cancer cell functions such as cell cycle, cell-cell signalling, cell movement, cell death and inflammatory response. However, these changes are mediated through cancer type-specific alteration of expression, with very few common targets across tumour types. As highlighted by these in vitro data, the reciprocal relationship of E-cadherin and polymeric immunoglobulin receptor (PIGR) expression in cancer cells could be shown, in vivo, to be dependent on the stromal content of human pancreatic cancer. These studies demonstrate that context-specific cancer-stroma crosstalk requires to be precisely defined for effective therapeutic targeting. These data may be relevant to non-malignant processes where epithelial cells interact with stromal cells, such as chronic inflammatory and fibrotic conditions.


Conflict of interest statement

No conflicts of interest were declared.

Figures

Figure 1
Figure 1
Effects of stellate cells on ECM gel contraction and cancer cell number. Organotypic culture gels were constructed by seeding specific ratios (a) of cancer cells [either Capan1 (b–i) or AsPc1] and stellate cells (PS1). As the proportion of stellate cells increased, reduction in length and increase in thickness of the ECM gels were observed (b–i), associated with increased ratios of absolute final cancer cell count to starting cell numbers (j). Broken lines (c, h) show the extent of measurement of organotypic ECM ‘cellular’ length. Bold lines in (c, h) indicate gel thickness; scale bar = 1000 μm. Fractional polynomial regression lines [bold; 95% confidence intervals (shaded areas) demonstrate contractions of ECM gels, length (k), thickness (l)] in cancer–stellate cell organotypic culture gels (Capan1:PS1, AsPC1:PS1) as opposed to epithelial–stellate (DEC:PS1) or cancer cells alone (Capan1) gels. Maximum contraction was observed when stellate cells formed 66% or 83% of the starting cell number (arrows). A marked increase in the fold-change of epithelial cells (m) with a steep upward trend was noted from starting stellate proportion of 0.66 onwards (arrows) (see Supplementary material, Figure S1, for raw data). Statistical significance of the specific points of change determined by Friedman's test with Dunn's multiple comparison test. Details of regression models used are summarized in Table S4 (see Supplementary material).
Figure 2
Figure 2
Stellate cell effects on survival, invasion and E-cadherin and β-catenin expression. Fractional polynomial regression lines (bold), along with 95% confidence intervals (shaded areas), demonstrate that increasing the proportion of stellate cells caused an increase in the percentage of proliferating cancer cells (a), concomitant with a decrease in the percentage of apoptotic cancer cells (b), when the starting stellate cell proportion was 0.66–0.83 (seen in both Capan1:PS1 and AsPc1:PS1 organotypic cultures). Control gels (DEC:PS1 or cancer cells alone) demonstrated no change in the proliferative or apoptotic fractions. The number of invading single cancer cells (c) and invading cohorts of cancer cells (d) (for raw data, see Supplementary material, Figure S3). The number of invading cohorts and single cancer cells increased as the proportion of stellate cells increased with maximal effect at stellate cell proportions of 0.66–0.83 (arrows). The expression of previously described proteins [10,13] for cell–cell adhesion (E-cadherin, e) and pro-survival (β-catenin, f) ‘per non-invaded cancer cell’ (for raw data, see Supplementary material, Figure S7). Stellate cells at a proportion of 0.66–0.83 (arrows) decreased the cancer cell expression of E-cadherin and β-catenin maximally. The statistical significance of the specific points of change was determined by Friedman's test with Dunn's multiple comparison test. Details of regression models are summarized in Table S4 (see Supplementary material).
Figure 3
Figure 3
Cancer-specific stromal cell alterations in gene expression. Ingenuity Pathway analysis of gene expression microarray data demonstrated that similar pathways were affected in cancer cells upon signalling from stromal cells in pancreatic (a), skin (b) and oesophageal (c) cancer. Graphs represent the negative log of a range of p values (x axis) of various subfunctions of genes involved in cellular functions (y axis). The red line denotes significance, determined by right-tailed Fisher's exact test, with a p value of < 0.05 after applying Benjamini–Hochberg approach for multiple testing [22]. There is considerable heterogeneity in the specific genes affected, as demonstrated by the Venn diagram (d). Specific genes in pancreatic and skin cancer models influenced by stromal cells were plotted as log-fold change (e), demonstrating no consistent pattern across the two gene sets. Specific gene sets in the different subgroups (I–VIII) are listed in Table S6 (see Supplementary material).
Figure 4
Figure 4
Confirmation of gene expression changes by qRT–PCR. The topmost up- or down-regulated genes for pancreatic cancer upon exposure to activated stellate cells were selected and validated by qRT–PCR of independent organotypic cultures. Heat map of log fold changes, which ranged from −4 (most down-regulated) to +2 (most up-regulated). Further, key cancer-related biological functions were identified and the involvement of each gene in a particular cellular function is depicted in the heat map on the right. The genes cluster in hierarchy into two major sets with four minor groups, depending on cellular function (binary coding) and log2-fold change in expression detected by gene-expression microarray and qRT–PCR. PIGR is a gene involved in most cellular functions, such as cell signalling, inflammatory response, cell growth, death and movement.
Figure 5
Figure 5
Confirmation of changes in protein expression in organotypic cultures and human tissue samples. Intense PIGR staining was noted in cancer cells when the stellate cell proportion was 0.66–0.83, which correlated inversely to expression of E-cadherin (a) in organotypic cultures; fractional polynomial regression lines (bold), along with 95% confidence intervals (shaded areas) of PIGR staining intensity (b). Inverse relation of E-cadherin expression to PIGR expression and the stromal context in vivo in human PDAC (c), validating the observations made in the physiomimetic in vitro organotypic cultures; scale bar = 100 μm. Scatter plot with fitted trend line shows a significant positive correlation between PIGR:E-cadherin staining and the proportion of stellate cells (d). Log-transformed PIGR:E-cadherin ratio was used.

Comment in

References

    1. Erkan M, Michalski CW, Rieder S, et al. The activated stroma index is a novel and independent prognostic marker in pancreatic ductal adenocarcinoma. Clin Gastroenterol Hepatol. 2008;6:1155–1161. - PubMed
    1. Fujita H, Ohuchida K, Mizumoto K, et al. α-Smooth muscle actin expressing stroma promotes an aggressive tumor biology in pancreatic ductal adenocarcinoma. Pancreas. 2010;39:1254–1262. - PubMed
    1. Wang K, Ma W, Wang J, et al. Tumor:stroma ratio is an independent predictor for survival in esophageal squamous cell carcinoma. J Thorac Oncol. 2012;7:1457–1461. - PubMed
    1. Woenne EC, Lederle W, Zwick S, et al. MMP inhibition blocks fibroblast-dependent skin cancer invasion, reduces vascularization and alters VEGF-A and PDGF-BB expression. Anticancer Res. 2012;30:703–711. - PubMed
    1. Hanahan D, Weinberg RA. Hallmarks of cancer: the next generation. Cell. 2011;144:646–674. - PubMed

Publication types

MeSH terms