The effects of GATA-1 and NF-E2 deficiency on bone biomechanical, biochemical, and mineral properties
- PMID: 23359245
- PMCID: PMC4128339
- DOI: 10.1002/jcp.24322
The effects of GATA-1 and NF-E2 deficiency on bone biomechanical, biochemical, and mineral properties
Abstract
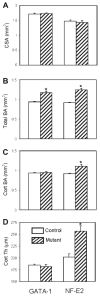
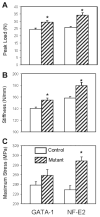
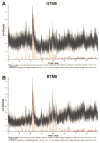
Mice deficient in GATA-1 or NF-E2, transcription factors required for normal megakaryocyte (MK) development, have increased numbers of MKs, reduced numbers of platelets, and a striking high bone mass phenotype. Here, we show the bone geometry, microarchitecture, biomechanical, biochemical, and mineral properties from these mutant mice. We found that the outer geometry of the mutant bones was similar to controls, but that both mutants had a striking increase in total bone area (up to a 35% increase) and trabecular bone area (up to a 19% increase). Interestingly, only the NF-E2 deficient mice had a significant increase in cortical bone area (21%) and cortical thickness (27%), which is consistent with the increase in bone mineral density (BMD) seen only in the NF-E2 deficient femurs. Both mutant femurs exhibited significant increases in several biomechanical properties including peak load (up to a 32% increase) and stiffness (up to a 13% increase). Importantly, the data also demonstrate differences between the two mutant mice. GATA-1 deficient femurs break in a ductile manner, whereas NF-E2 deficient femurs are brittle in nature. To better understand these differences, we examined the mineral properties of these bones. Although none of the parameters measured were different between the NF-E2 deficient and control mice, an increase in calcium (21%) and an increase in the mineral/matrix ratio (32%) was observed in GATA-1 deficient mice. These findings appear to contradict biomechanical findings, suggesting the need for further research into the mechanisms by which GATA-1 and NF-E2 deficiency alter the material properties of bone.
Copyright © 2013 Wiley Periodicals, Inc.
Conflict of interest statement
Conflicts of interest: nothing to declare.
Figures


Similar articles
-
Megakaryocyte-osteoblast interaction revealed in mice deficient in transcription factors GATA-1 and NF-E2.J Bone Miner Res. 2004 Apr;19(4):652-60. doi: 10.1359/JBMR.0301254. Epub 2003 Dec 22. J Bone Miner Res. 2004. PMID: 15005853
-
GATA-1 deficiency rescues trabecular but not cortical bone in OPG deficient mice.J Cell Physiol. 2015 Apr;230(4):783-90. doi: 10.1002/jcp.24803. J Cell Physiol. 2015. PMID: 25205203 Free PMC article.
-
Loss of the transcription factor p45 NF-E2 results in a developmental arrest of megakaryocyte differentiation and the onset of a high bone mass phenotype.Bone. 2005 Feb;36(2):215-23. doi: 10.1016/j.bone.2004.09.024. Bone. 2005. PMID: 15780947
-
A reciprocal regulatory interaction between megakaryocytes, bone cells, and hematopoietic stem cells.Bone. 2006 Nov;39(5):978-984. doi: 10.1016/j.bone.2006.05.019. Epub 2006 Jul 21. Bone. 2006. PMID: 16860008 Review.
-
Cellular and molecular biology of megakaryocyte differentiation in the absence of lineage-restricted transcription factors.Stem Cells. 1998;16 Suppl 2:91-5. doi: 10.1002/stem.5530160712. Stem Cells. 1998. PMID: 11012181 Review.
Cited by
-
Megakaryocyte Secreted Factors Regulate Bone Marrow Niche Cells During Skeletal Homeostasis, Aging, and Disease.Calcif Tissue Int. 2023 Jul;113(1):83-95. doi: 10.1007/s00223-023-01095-y. Epub 2023 May 27. Calcif Tissue Int. 2023. PMID: 37243755 Free PMC article. Review.
-
Regulation and function of the NFE2 transcription factor in hematopoietic and non-hematopoietic cells.Cell Mol Life Sci. 2015 Jun;72(12):2323-35. doi: 10.1007/s00018-015-1866-6. Epub 2015 Feb 27. Cell Mol Life Sci. 2015. PMID: 25721735 Free PMC article. Review.
-
Biological regulation of bone quality.Curr Osteoporos Rep. 2014 Sep;12(3):366-75. doi: 10.1007/s11914-014-0213-4. Curr Osteoporos Rep. 2014. PMID: 24894149 Free PMC article. Review.
-
Inhibition of Osteoblast Differentiation by JAK2V617F Megakaryocytes Derived From Male Mice With Primary Myelofibrosis.Front Oncol. 2022 Jul 8;12:929498. doi: 10.3389/fonc.2022.929498. eCollection 2022. Front Oncol. 2022. PMID: 35880162 Free PMC article.
-
Aging negatively impacts the ability of megakaryocytes to stimulate osteoblast proliferation and bone mass.Bone. 2019 Oct;127:452-459. doi: 10.1016/j.bone.2019.07.010. Epub 2019 Jul 9. Bone. 2019. PMID: 31299382 Free PMC article.
References
-
- Alexander JM, Bab I, Fish S, Muller R, Uchiyama T, Gronowicz G, Nahounou M, Zhao Q, White DW, Chorev M, Gazit D, Rosenblatt M. Human parathyroid hormone 1–34 reverses bone loss in ovariectomized mice. J Bone Miner Res. 2001;16:1665–1673. - PubMed
-
- Baron R, Tross R, Vignery A. Evidence of sequential remodeling in rat trabecular bone: Morphology, dynamic histomorphometry, and changes during skeletal maturation. Anat Rec. 1984;208:137–145. - PubMed
-
- Beamer WG, Donahue LR, Rosen CJ, Baylink DJ. Genetic variability in adult bone density among inbred strains of mice. Bone. 1996;18:397–403. - PubMed
-
- Boskey AL, Pleshko N, Doty SB, Mendelsohn R. Applications of Fourier transform infrared (FT-IR) microscopy to the study of mineralization in bone and cartilage. Cell Mater. 1992;2:209–220.
Publication types
MeSH terms
Substances
Grants and funding
LinkOut - more resources
Full Text Sources
Other Literature Sources
Medical

