

The potential role of HMGB1 release in peritoneal dialysis-related peritonitis
- PMID: 23359306
- PMCID: PMC3554653
- DOI: 10.1371/journal.pone.0054647
The potential role of HMGB1 release in peritoneal dialysis-related peritonitis
Abstract
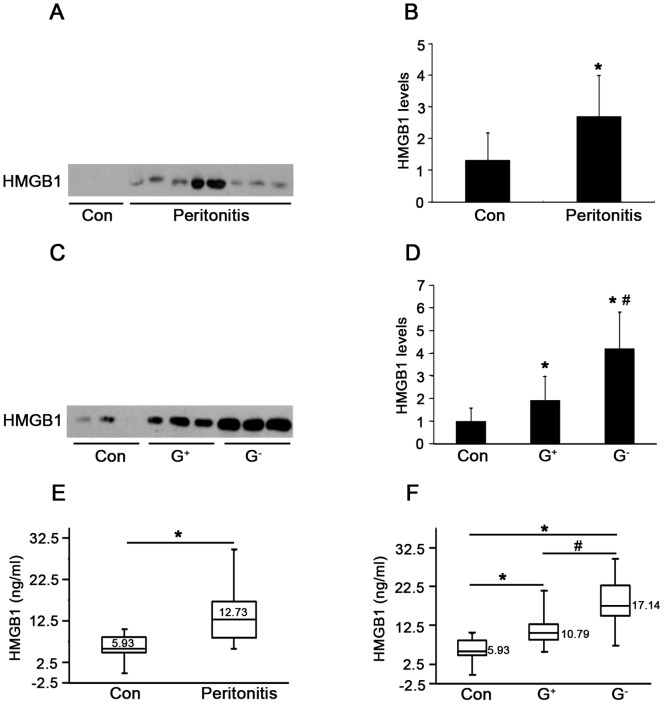
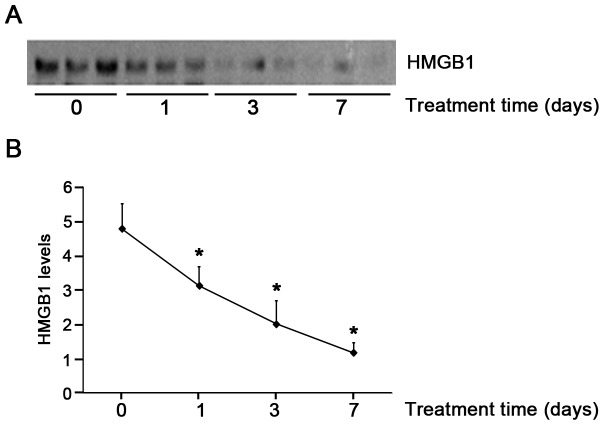
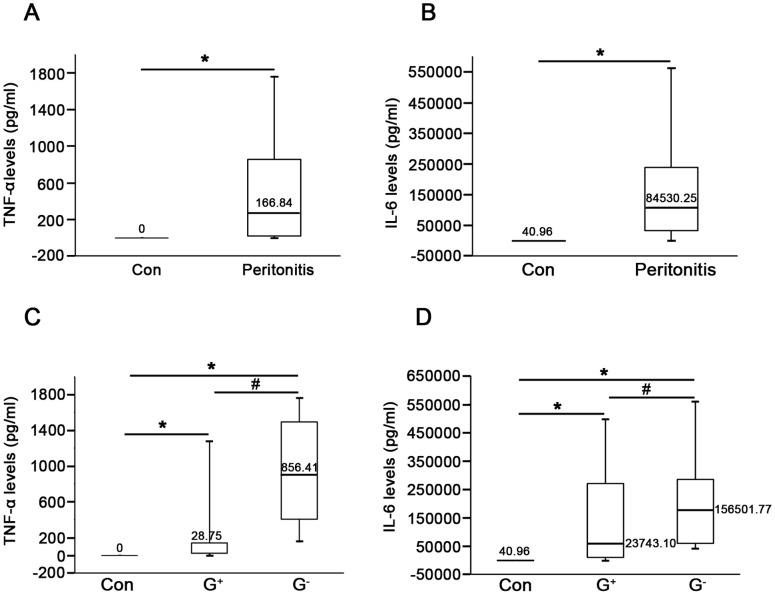
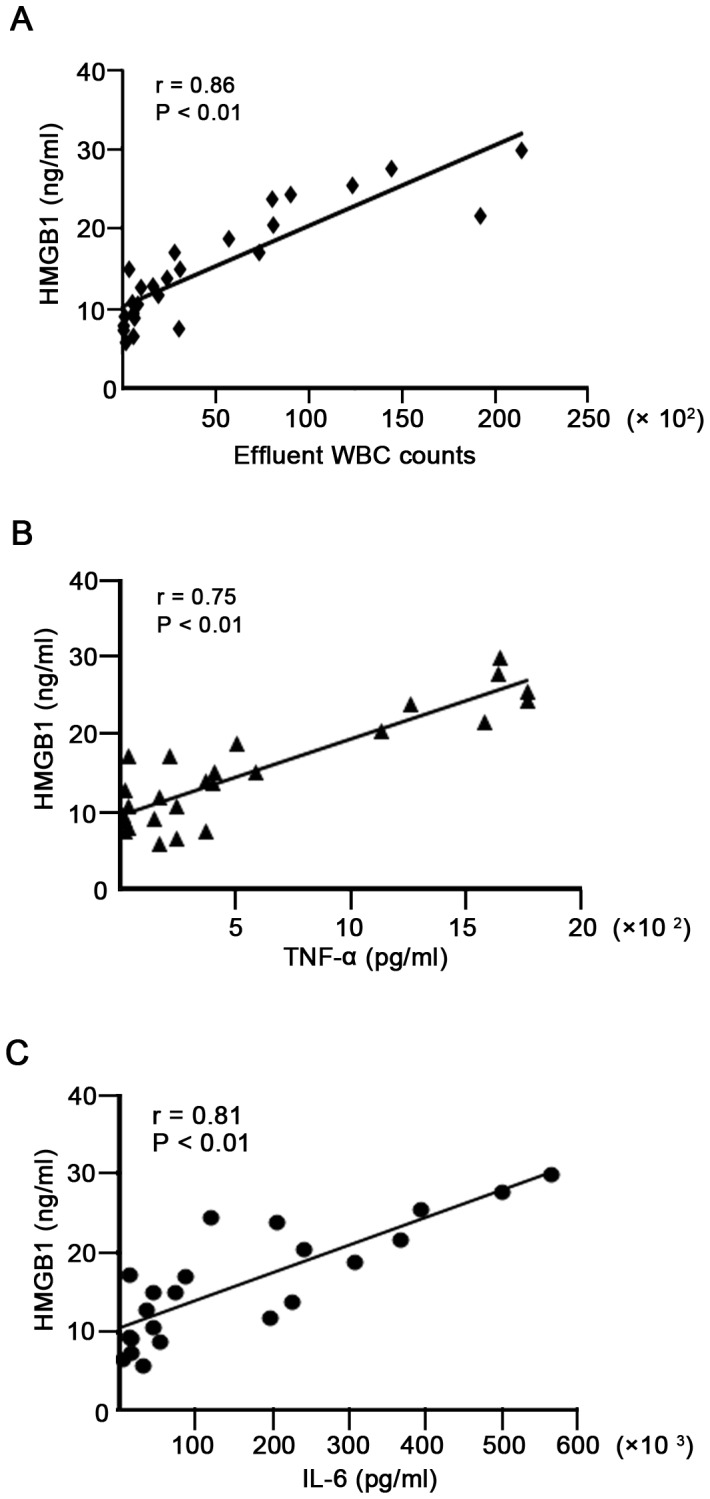
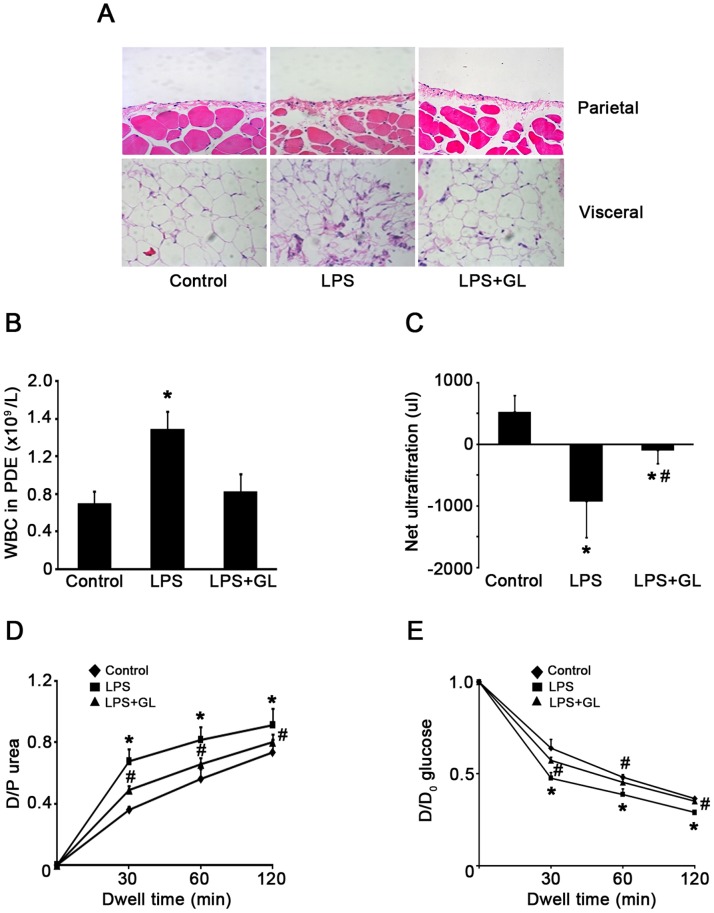
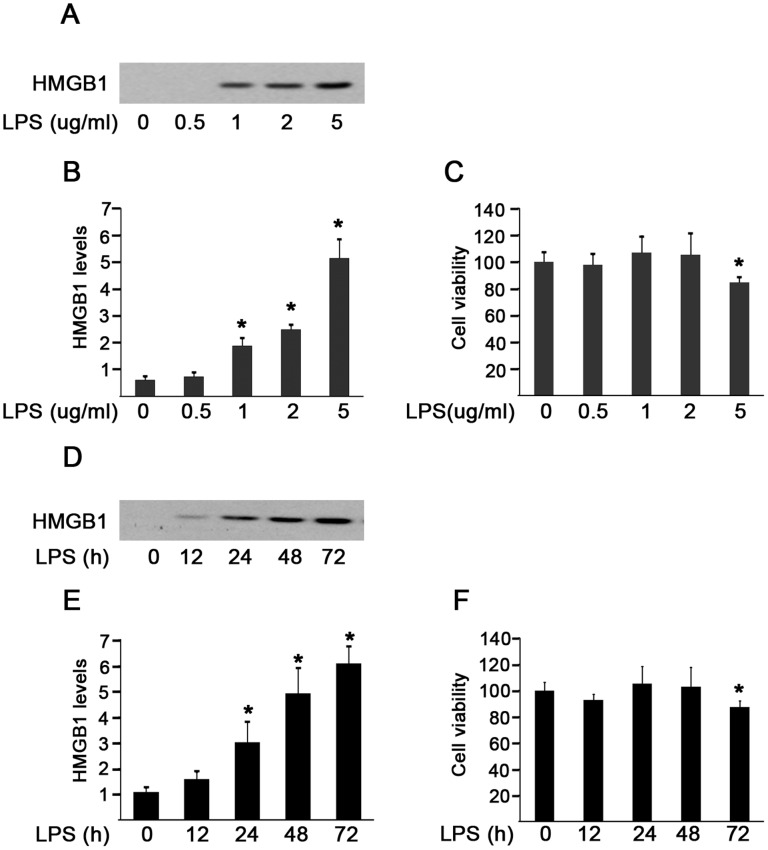
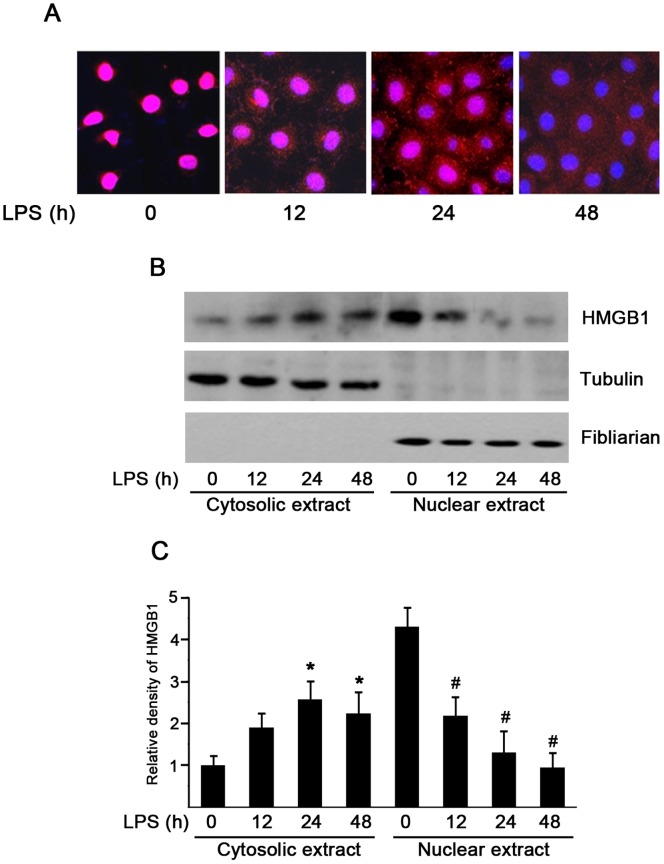
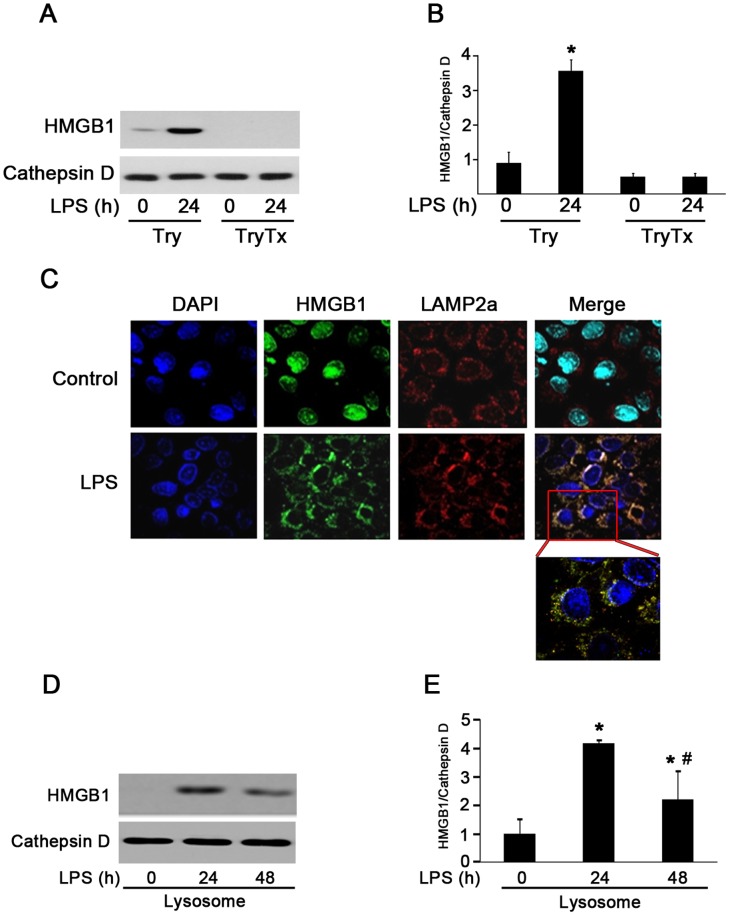
High mobility group box 1 (HMGB1), a DNA-binding nuclear protein, has been implicated as an endogenous danger signal in the pathogenesis of infection diseases. However, the potential role and source of HMGB1 in the peritoneal dialysis (PD) effluence of patients with peritonitis are unknown. First, to evaluate HMDB1 levels in peritoneal dialysis effluence (PDE), a total of 61 PD patients were enrolled in this study, including 42 patients with peritonitis and 19 without peritonitis. Demographic characteristics, symptoms, physical examination findings and laboratory parameters were recorded. HMGB1 levels in PDE were determined by Western blot and ELISA. The concentrations of TNF-α and IL-6 in PDE were quantified by ELISA. By animal model, inhibition of HMGB1 with glycyrrhizin was performed to determine the effects of HMGB1 in LPS-induced mice peritonitis. In vitro, a human peritoneal mesothelial cell line (HMrSV5) was stimulated with lipopolysaccharide (LPS), HMGB1 extracellular content in the culture media and intracellular distribution in various cellular fractions were analyzed by Western blot or immunofluorescence. The results showed that the levels of HMGB1 in PDE were higher in patients with peritonitis than those in controls, and gradually declined during the period of effective antibiotic treatments. Furthermore, the levels of HMGB1 in PDE were positively correlated with white blood cells (WBCs) count, TNF-α and IL-6 levels. However, pretreatment with glycyrrhizin attenuated LPS-induced acute peritoneal inflammation and dysfunction in mice. In cultured HMrSV5 cells, LPS actively induced HMGB1 nuclear-cytoplasmic translocation and release in a time and dose-dependent fashion. Moreover, cytosolic HMGB1 was located in lysosomes and secreted via a lysosome-mediated secretory pathway following LPS stimulation. Our study demonstrates that elevated HMGB1 levels in PDE during PD-related peritonitis, at least partially, from peritoneal mesothelial cells, which may be involved in the process of PD-related peritonitis and play a critical role in acute peritoneal dysfunction.
Conflict of interest statement
Figures
Similar articles
-
Acetylation of HMGB1 by JNK1 Signaling Promotes LPS-Induced Peritoneal Mesothelial Cells Apoptosis.Biomed Res Int. 2018 Nov 12;2018:2649585. doi: 10.1155/2018/2649585. eCollection 2018. Biomed Res Int. 2018. PMID: 30539006 Free PMC article.
-
Peritoneal dialysis effluent, cytokine levels, and peritoneal mesothelial cell viability in CAPD: a possible relationship.Adv Perit Dial. 1997;13:7-12. Adv Perit Dial. 1997. PMID: 9360642
-
Inhibition effect of glycyrrhizin in lipopolysaccharide-induced high-mobility group box 1 releasing and expression from RAW264.7 cells.Shock. 2015 Apr;43(4):412-21. doi: 10.1097/SHK.0000000000000309. Shock. 2015. PMID: 25526376
-
Factors increasing severity of peritonitis in long-term peritoneal dialysis patients.Adv Ren Replace Ther. 1998 Jul;5(3):185-93. doi: 10.1016/s1073-4449(98)70031-7. Adv Ren Replace Ther. 1998. PMID: 9686629 Review.
-
Pathophysiological changes to the peritoneal membrane during PD-related peritonitis: the role of mesothelial cells.Mediators Inflamm. 2012;2012:484167. doi: 10.1155/2012/484167. Epub 2012 Apr 10. Mediators Inflamm. 2012. PMID: 22577250 Free PMC article. Review.
Cited by
-
Proinflammatory Effect of High Glucose Concentrations on HMrSV5 Cells via the Autocrine Effect of HMGB1.Front Physiol. 2017 Sep 29;8:762. doi: 10.3389/fphys.2017.00762. eCollection 2017. Front Physiol. 2017. PMID: 29033853 Free PMC article.
-
Free Light Chains, High Mobility Group Box 1, and Mortality in Hemodialysis Patients.J Clin Med. 2022 Nov 23;11(23):6904. doi: 10.3390/jcm11236904. J Clin Med. 2022. PMID: 36498479 Free PMC article.
-
Dynamic localization and the associated translocation mechanism of HMGBs in response to GCRV challenge in CIK cells.Cell Mol Immunol. 2015 May;12(3):342-53. doi: 10.1038/cmi.2014.55. Epub 2014 Jul 21. Cell Mol Immunol. 2015. PMID: 25042634 Free PMC article.
-
Sterile inflammation of peritoneal membrane caused by peritoneal dialysis: focus on the communication between immune cells and peritoneal stroma.Front Immunol. 2024 May 8;15:1387292. doi: 10.3389/fimmu.2024.1387292. eCollection 2024. Front Immunol. 2024. PMID: 38779674 Free PMC article. Review.
-
Toll-Like Receptors 2 and 4 Are Potential Therapeutic Targets in Peritoneal Dialysis-Associated Fibrosis.J Am Soc Nephrol. 2017 Feb;28(2):461-478. doi: 10.1681/ASN.2015080923. Epub 2016 Jul 18. J Am Soc Nephrol. 2017. PMID: 27432741 Free PMC article.
References
-
- Nessim SJ (2011) Prevention of peritoneal dialysis-related infections. Semin Nephrol 31: 199–212. - PubMed
-
- Yung S, Li FK, Chan TM (2006) Peritoneal mesothelial cell culture and biology. Perit Dial Int 26: 162–173. - PubMed
-
- Lotze MT, Tracey KJ (2005) High-mobility group box 1 protein (HMGB1): nuclear weapon in the immune arsenal. Nat Rev Immunol 5: 331–342. - PubMed
-
- Scaffidi P, Misteli T, Bianchi ME (2002) Release of chromatin protein HMGB1 by necrotic cells triggers inflammation. Nature 418: 191–195. - PubMed
-
- Wang H, Bloom O, Zhang M, Vishnubhakat JM, Ombrellino M, et al. (1999) HMG-1 as a late mediator of endotoxin lethality in mice. Science 285: 248–251. - PubMed
Publication types
MeSH terms
Substances
LinkOut - more resources
Full Text Sources
Other Literature Sources
