. 2013;8(1):e54491.
doi: 10.1371/journal.pone.0054491. Epub 2013 Jan 24.

Transgenic overexpression of 14-3-3 zeta protects hippocampus against endoplasmic reticulum stress and status epilepticus in vivo

Affiliations

Transgenic overexpression of 14-3-3 zeta protects hippocampus against endoplasmic reticulum stress and status epilepticus in vivo

Gary P Brennan et al. PLoS One. 2013.

Abstract

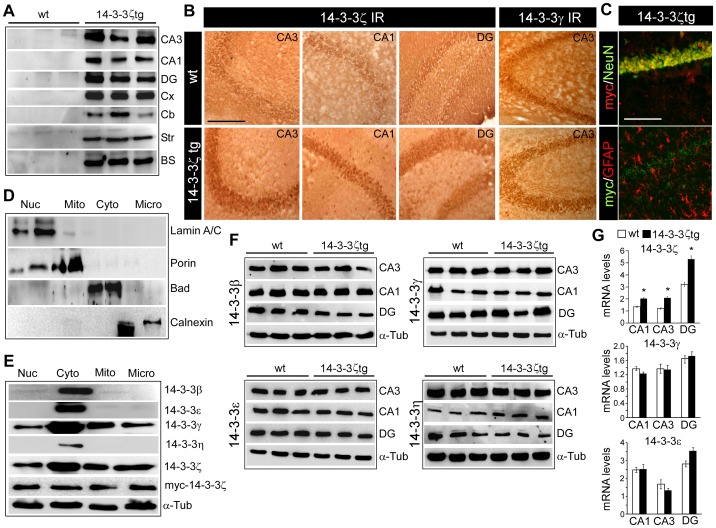
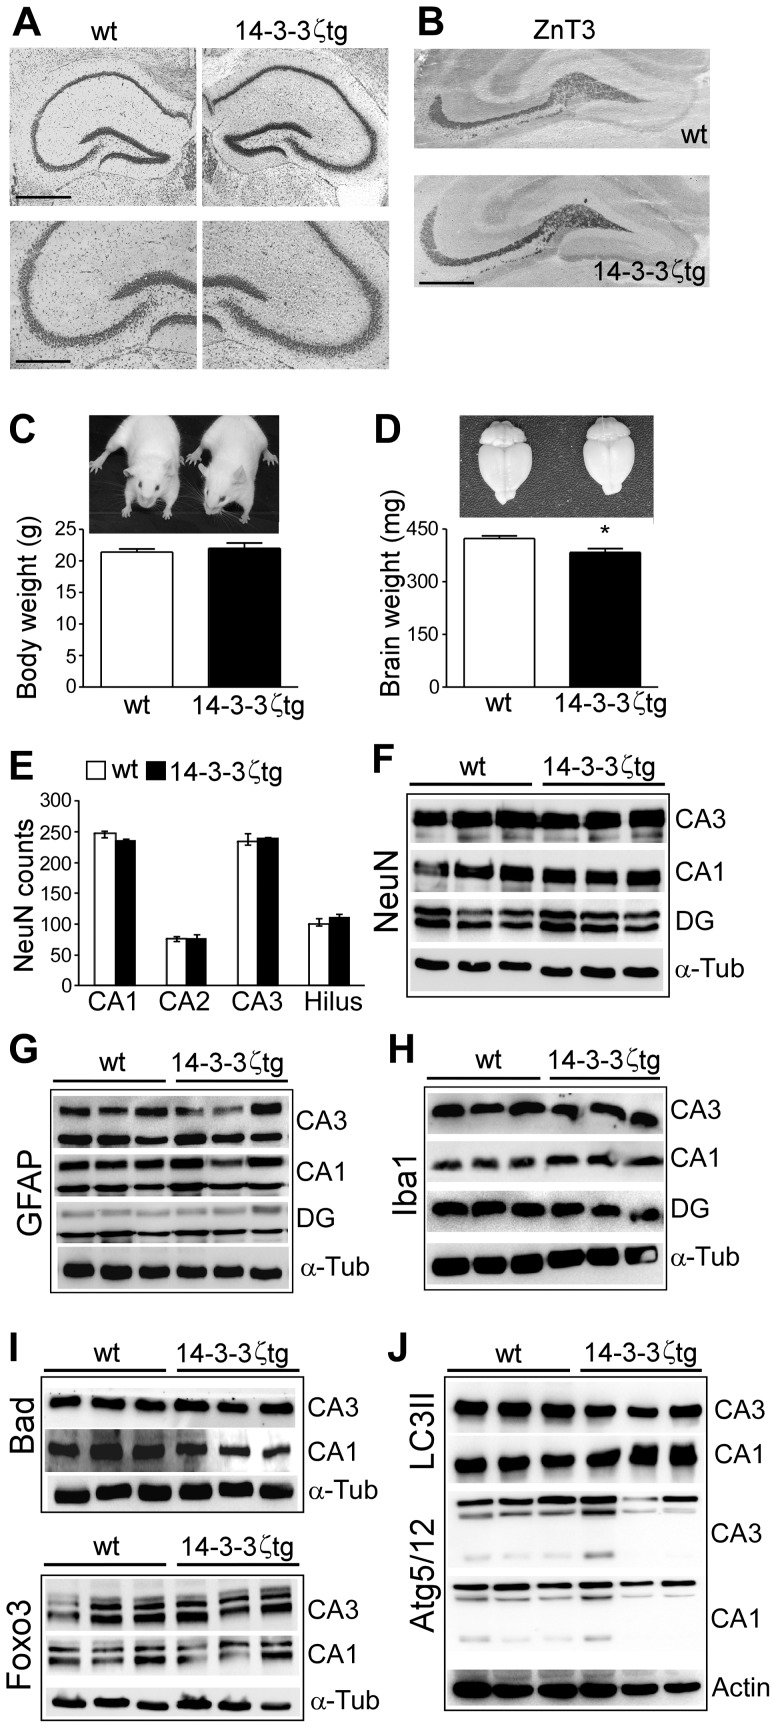
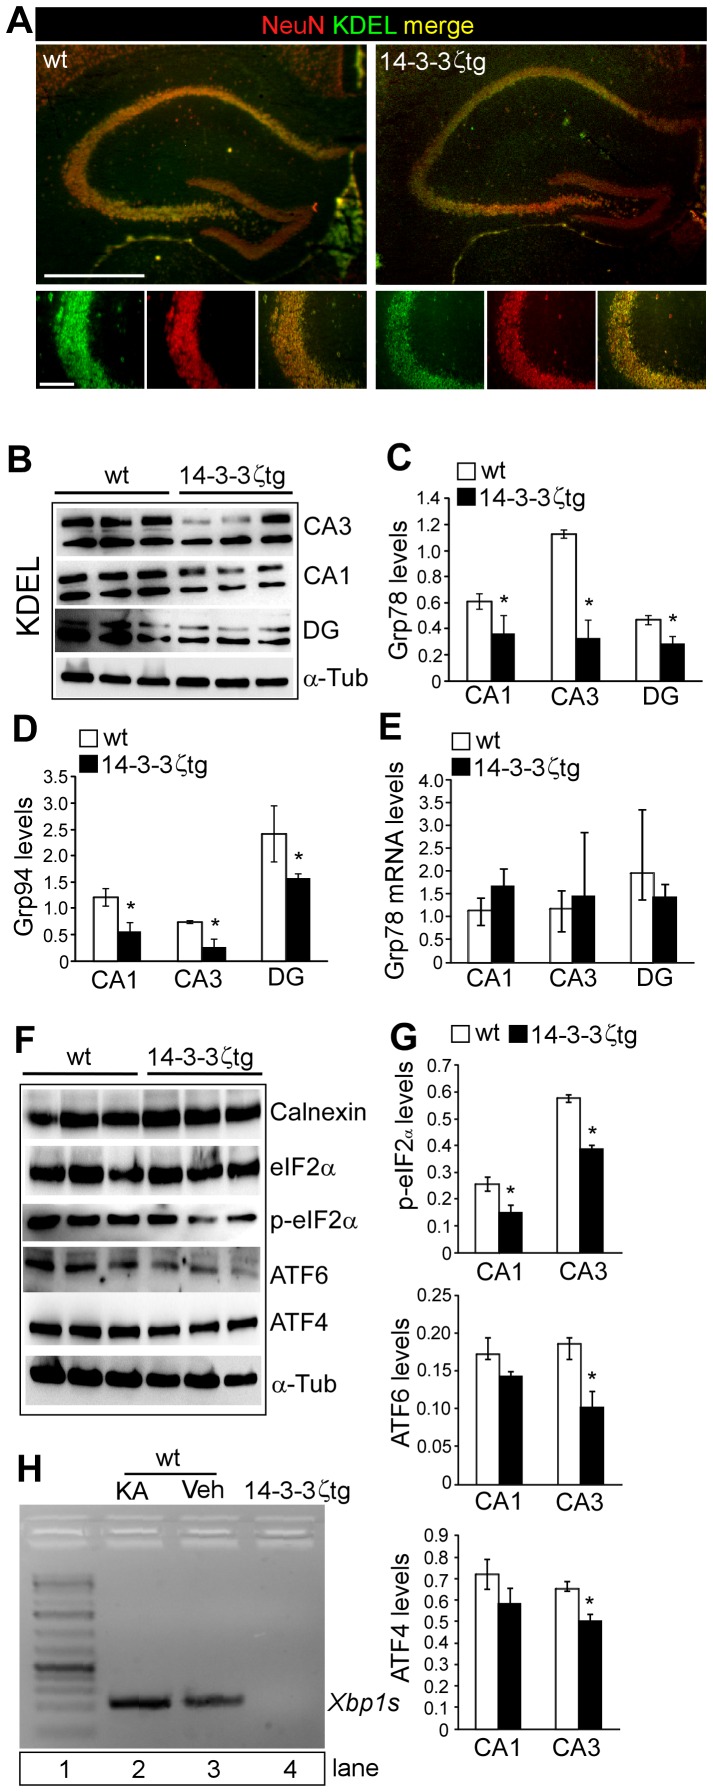
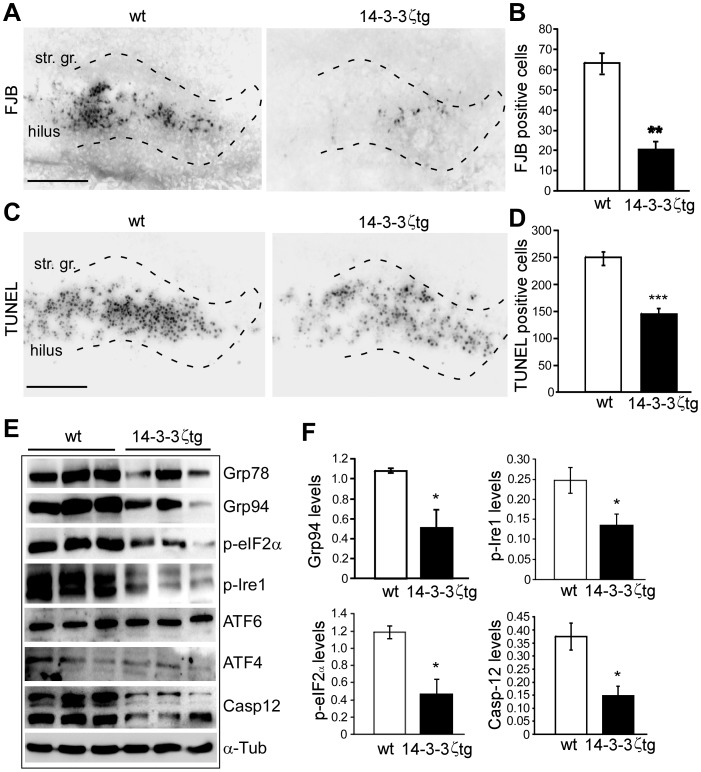
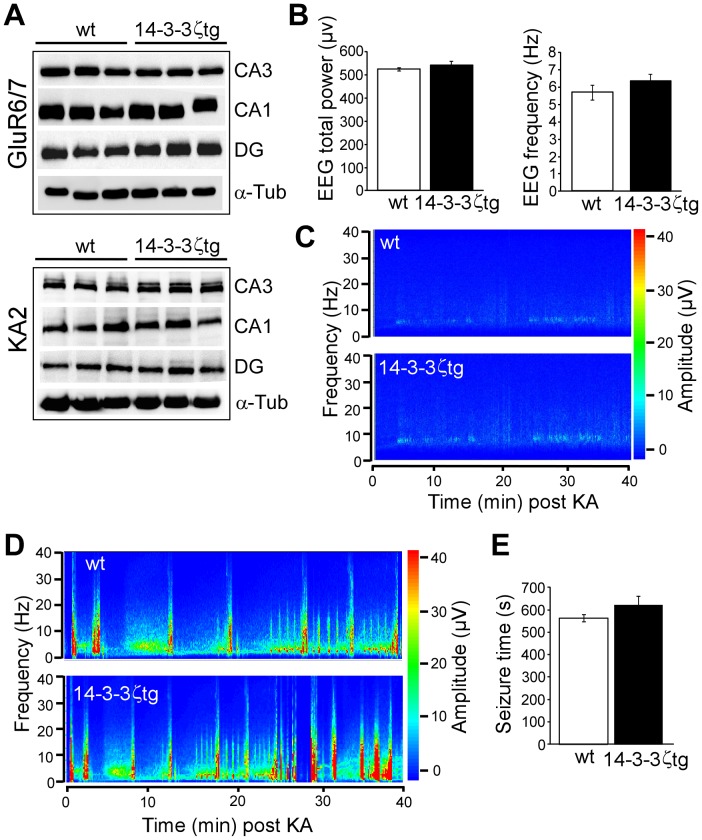
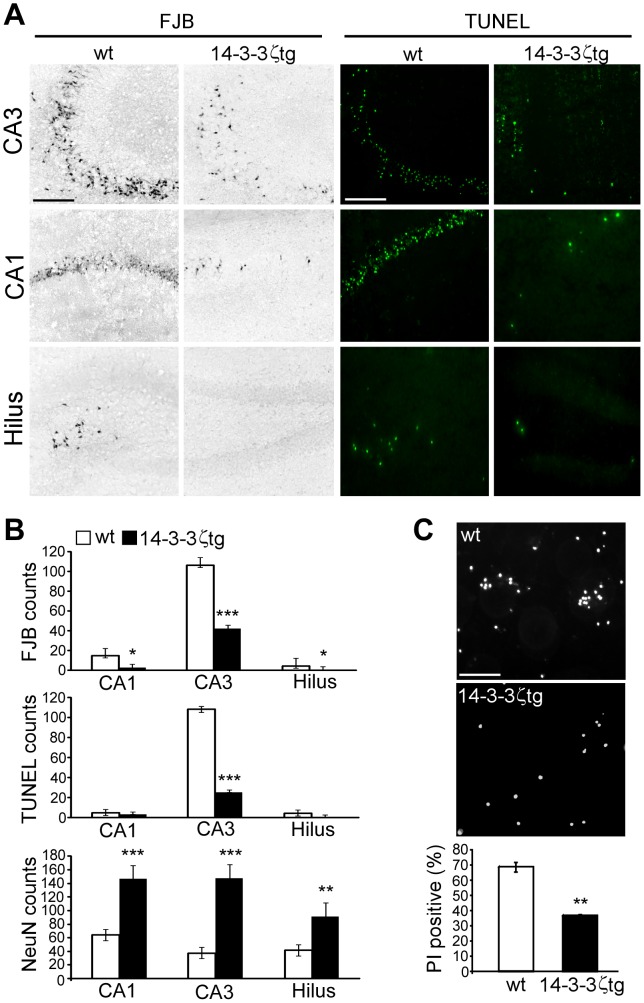
14-3-3 proteins are ubiquitous molecular chaperones that are abundantly expressed in the brain where they regulate cell functions including metabolism, the cell cycle and apoptosis. Brain levels of several 14-3-3 isoforms are altered in diseases of the nervous system, including epilepsy. The 14-3-3 zeta (ζ) isoform has been linked to endoplasmic reticulum (ER) function in neurons, with reduced levels provoking ER stress and increasing vulnerability to excitotoxic injury. Here we report that transgenic overexpression of 14-3-3ζ in mice results in selective changes to the unfolded protein response pathway in the hippocampus, including down-regulation of glucose-regulated proteins 78 and 94, activating transcription factors 4 and 6, and Xbp1 splicing. No differences were found between wild-type mice and transgenic mice for levels of other 14-3-3 isoforms or various other 14-3-3 binding proteins. 14-3-3ζ overexpressing mice were potently protected against cell death caused by intracerebroventricular injection of the ER stressor tunicamycin. 14-3-3ζ overexpressing mice were also potently protected against neuronal death caused by prolonged seizures. These studies demonstrate that increased 14-3-3ζ levels protect against ER stress and seizure-damage despite down-regulation of the unfolded protein response. Delivery of 14-3-3ζ may protect against pathologic changes resulting from prolonged or repeated seizures or where injuries provoke ER stress.


Conflict of interest statement

Competing Interests: The authors have declared that no competing interests exist.

Figures

Figure 1
Figure 1. Distribution of the myc-tagged 14-3-3ζ transgene in mouse brain.
(A) Western blot analysis (n = 1 per lane) of microdissected brain regions from wild-type (wt) and 14-3-3ζtg mice immunoblotted with antibodies against the myc tag confirm expression of the transgene in CA subfields, dentate gyrus (DG), cortex (Cx), cerebellum (Cb), striatum (Str) and brain stem (BS). (B) 14-3-3ζ immunostaining in hippocampal tissue sections showing higher immunoreactivity (IR) in 14-3-3ζtg compared to wt mice. Panels to the far right show sections stained for 14-3-3γ revealing normal neuronal distribution and level between wt and 14-3-3ζtg mice. (C) Representative fluorescence immunostaining of the CA1 subfield showing (top) myc (red) with NeuN (green) co-localization and (bottom) myc (green) with GFAP (red) confirming mainly neuronal expression of the transgene. (D) Immunoblots of SJL mouse hippocampal fractions (n = 1 per lane) for the select presence of markers of the nucleus (Nuc), mitochondria (Mito), cytoplasm (Cyto) and microsome-containing ER fraction (Micro). (E) Western blots from pools of 14-3-3ζtg mouse hippocampi (n = 1 per lane) show the presence of various isoforms in different compartments. Note, endogenous 14-3-3ζ and myc-14-3-3ζ are similarly distributed in each fraction. (F) Protein levels of various 14-3-3 isoforms in wt and 14-3-3ζtg mice hippocampal subfields (n = 1 per lane). (G) Real-time PCR measurement of ζ, γ and ε 14-3-3 isoform levels in wt and 14-3-3ζtg mice (n = 3 per group). *p<0.05 compared to wt. Scale bars in B, C, 160 µm.
Figure 2
Figure 2. Hippocampal morphology and levels of apoptosis- and autophagy-related proteins in 14-3-3ζtg mice.
(A) Nissl-stained sections of wt and 14-3-3ζtg mice. Scale bar, (top) 600 µm; (bottom), 330 µm. (B) Immunohistochemistry showing similar pattern of ZnT3 staining, a protein present in mossy fibers, in wt and 14-3-3ζtg mice. Scale bar, 500 µm. (C) Body weight in wt and 14-3-3ζtg mice at 6 weeks of age (n = 8 per group). (D) Brain weight in wt and 14-3-3ζtg mice at 6 weeks of age (n = 6 per group). *p<0.05 compared to wt. (E) NeuN counts in hippocampal subfields from sections of dorsal hippocampus from wt and 14-3-3ζtg mice (n = 6 per group). (F-J) Representative western blots (n = 1 per lane) showing similar levels of (F) NeuN, (G) the astrocyte marker GFAP, (H) microglia marker Iba1, (I) apoptosis-associated 14-3-3 binding proteins and (J) autophagy-related 14-3-3 binding proteins, in adult wt and 14-3-3ζtg mice.
Figure 3
Figure 3. Reduced levels of ER and UPR-related proteins in 14-3-3ζtg mice.
(A) Representative KDEL (green) immunostaining for wt and 14-3-3ζtg mice hippocampus. Neurons are identified by NeuN counterstaining (red). Merged panels confirm staining is neuronal. Note, lower KDEL immunoreactivity in 14-3-3ζtg mice. Scale bar (top), 700 µm; (bottom), 150 µm. (B) Representative western blots (n = 1 per lane) showing KDEL-containing proteins in microdissected subfields of wt and 14-3-3ζtg mice. (C, D) Basal Grp78 and Grp94 protein levels in wt and 14-3-3ζtg mice (n = 3 per group). (E) Real-time PCR measurement of Grp78 levels in wt and 14-3-3ζtg mice in each subfield (n = 3 per group). (F) Western blots (n = 1 per lane) showing levels of various ER-related proteins in the CA3 subfield of 14-3-3ζtg mice compared to wt mice. (G) Graphs showing lower basal levels of p-eIF2α, ATF6 and ATF4 in select hippocampal subfields (n = 3 per group). (H) Gel showing levels of the spiced form of Xbp1 from hippocampal lysates of; (lane 2) WT mice subject to seizures levels, (lane 3) Wt mice, (lane 4) 14-3-3ζtg mice. Lane 1 is a ladder. *p<0.05 compared to wt.
Figure 4
Figure 4. 14-3-3ζtg mice are protected against ER stress-induced neuronal death in vivo.
(A) Representative FJB staining of wt and 14-3-3ζtg mouse hippocampus 48 h after i.c.v. injection of tunicamycin (1 µl, 50 µM). Scale bar, 150 µm. Dotted lines depict upper and lower blades of the granule cell layer. str. gr., stratum granulosum. (B) Counts of FJB-positive cells 48 h after tunicamycin in wt and 14-3-3ζtg mice (n = 5 per group; **p<0.01 compared to wt). (C, D) Representative photomicrographs showing TUNEL staining in wt and 14-3-3ζtg mice 48 h after tunicamycin injection and graph quantifying the difference (n = 5 per group; ***p<0.001 compared to wt. (E, F) Representative western blots (n = 1 per lane) and semi-quantification of UPR and ER-associated protein levels between wt and 14-3-3ζtg mice (n = 3 per group; *p<0.05 compared to wt).
Figure 5
Figure 5. Baseline and seizure EEG in 14-3-3ζtg mice.
(A). Protein levels of the kainic acid receptors GluR6/7 and KA2 in microdissected subfields of hippocampus from wt and 14-3-3ζtg mice. (B) Analysis of baseline EEG parameters during 40 min recordings from skull of wt and 14-3-3ζtg mice. No differences were detected between genotypes (n = 6 per group). (C) Representative EEG spectral activity plot of baseline EEG in wt and 14-3-3ζtg mice. (D, E) Representative spectral activity plot of EEG frequency and amplitude, and quantitative analysis of seizure duration (high amplitude and high frequency discharges) for wt and 14-3-3ζtg mice during the 40 min after intra-amygdala microinjection of kainic acid. No differences were detected between genotypes (n = 6-7 per group).
Figure 6
Figure 6. 14-3-3ζtg mice are protected against seizure-induced neuronal death in vivo and in vitro.
(A) Representative FJB and TUNEL staining for wt and 14-3-3ζtg mice 72 h after status epilepticus for the CA1, CA3 and hilar regions. Scale bar, 120 µm. (B) Semi-quantification of seizure damage and neuron survival (NeuN counts) for wt and 14-3-3ζtg mice (n = 6-10 per group). (C) Primary cultures of hippocampal neurons from wt and 14-3-3ζtg mice were treated with kainic acid and then cell death determined as percentage propidium iodide (PI) positive. (Panels above) Representative photomicrographs of PI-stained neurons 24 h after KA treatment. Scale bar, 25 µm. Graph shows reduced cell death in 14-3-3ζtg mice (n = 3 per group). *p<0.05; **p<0.01; ***p<0.001 compared to wt.

References

    1. van Hemert MJ, Steensma HY, van Heusden GP (2001) 14-3-3 proteins: key regulators of cell division, signalling and apoptosis. Bioessays 23: 936–946. - PubMed
    1. Berg D, Holzmann C, Riess O (2003) 14-3-3 proteins in the nervous system. Nature Rev Neurosci 4: 752–762. - PubMed
    1. Kaneko K, Hachiya NS (2006) The alternative role of 14-3-3 zeta as a sweeper of misfolded proteins in disease conditions. Med Hypotheses 67: 169–171. - PubMed
    1. O’Kelly I, Butler MH, Zilberberg N, Goldstein SA (2002) Forward transport. 14-3-3 binding overcomes retention in endoplasmic reticulum by dibasic signals. Cell 111: 577–588. - PubMed
    1. Toyo-oka K, Shionoya A, Gambello MJ, Cardoso C, Leventer R, et al. (2003) 14-3-3epsilon is important for neuronal migration by binding to NUDEL: a molecular explanation for Miller-Dieker syndrome. Nat Genet 34: 274–285. - PubMed

Publication types

LinkOut - more resources