. 2013;8(1):e54777.
doi: 10.1371/journal.pone.0054777. Epub 2013 Jan 24.

An intact brachyury function is necessary to prevent spurious axial development in Xenopus laevis

Affiliations

An intact brachyury function is necessary to prevent spurious axial development in Xenopus laevis

Cecilia E Aguirre et al. PLoS One. 2013.

Abstract

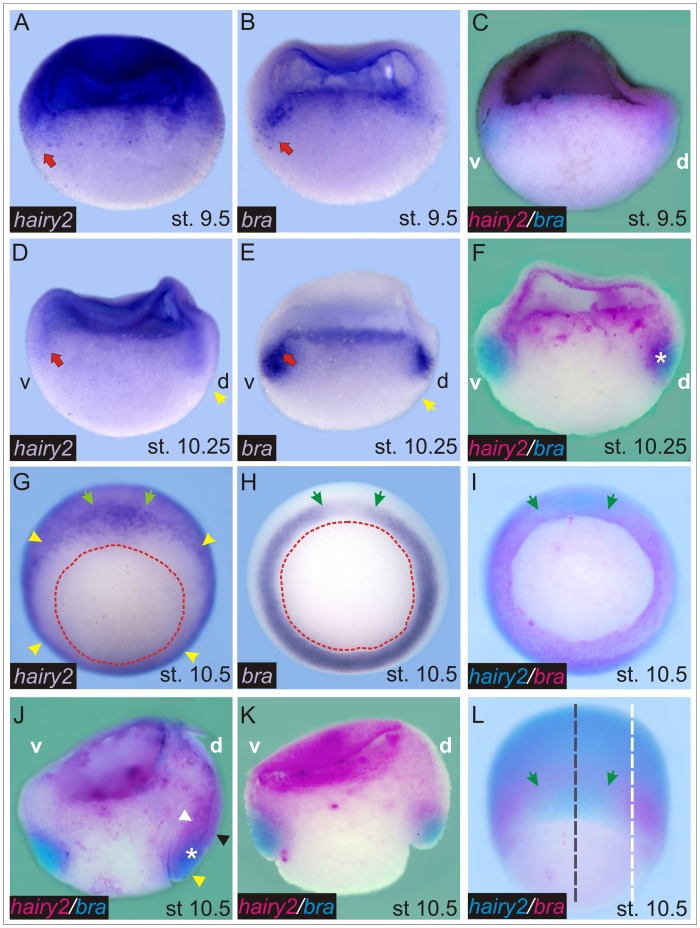
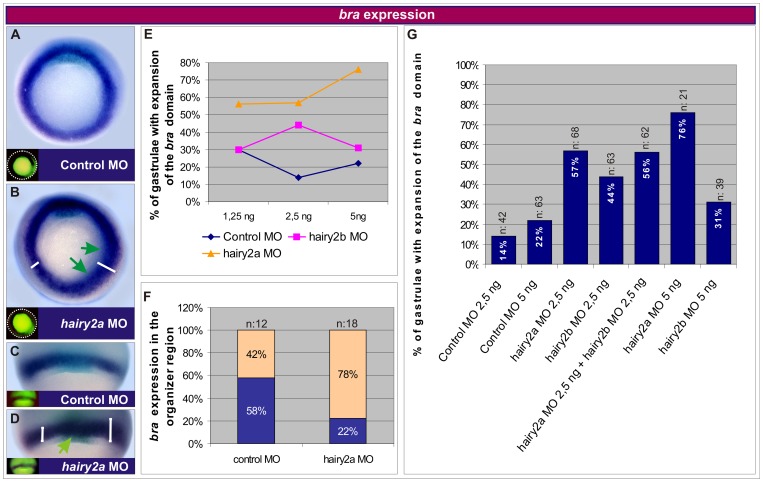
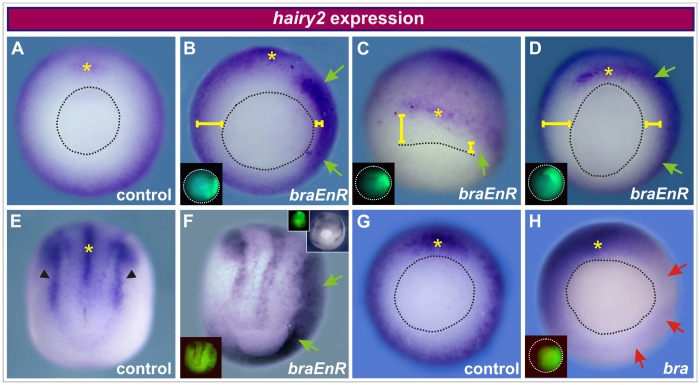
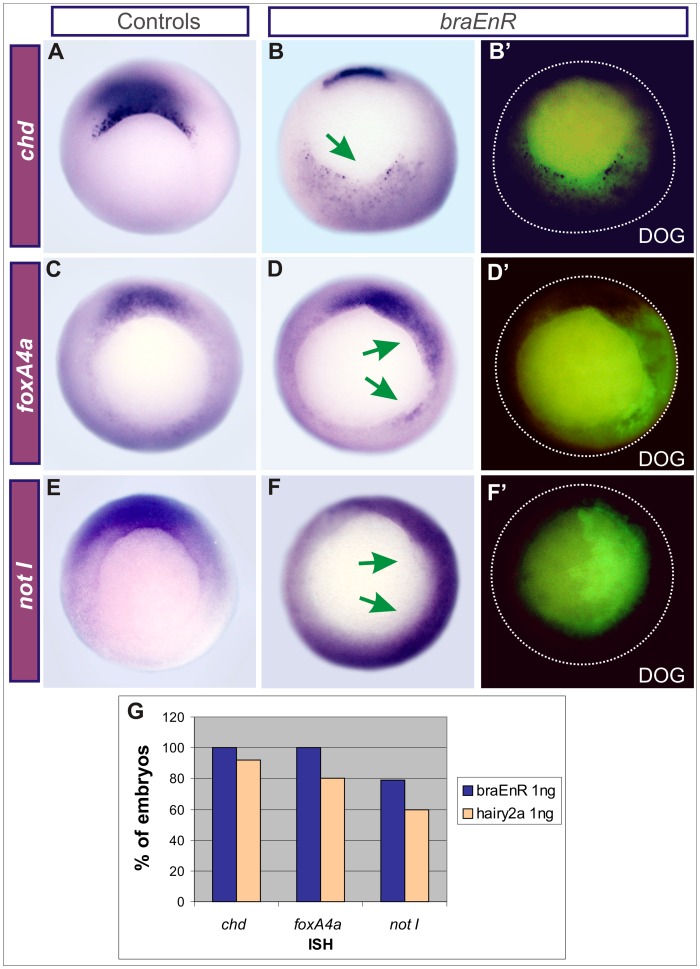
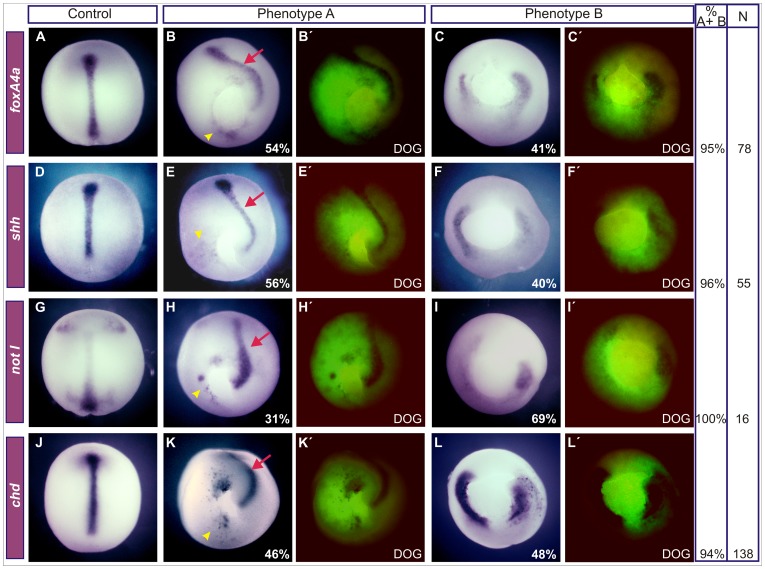
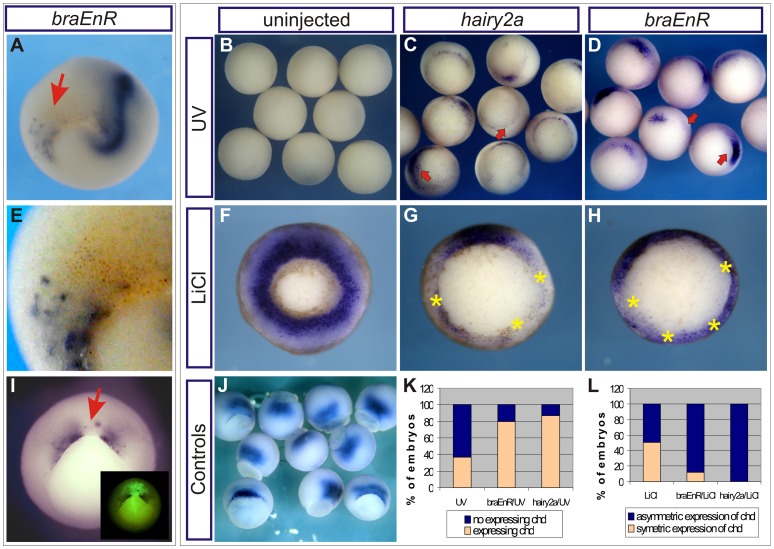
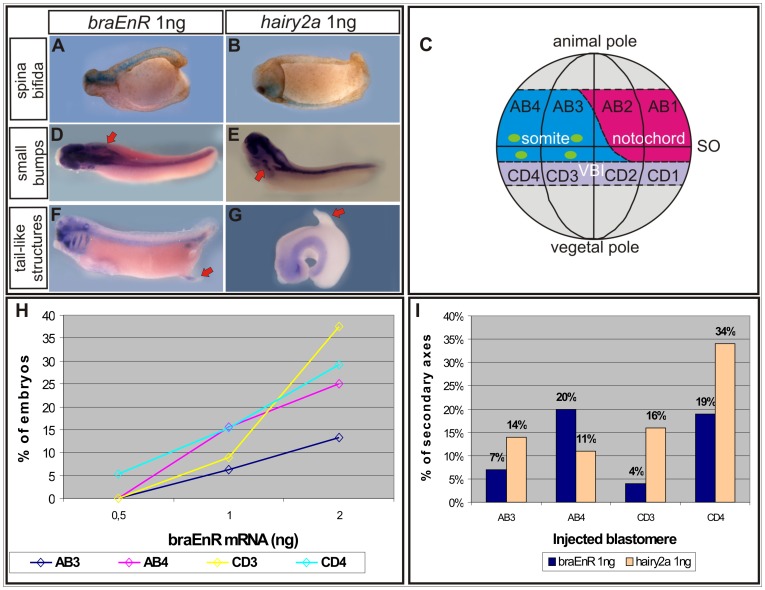
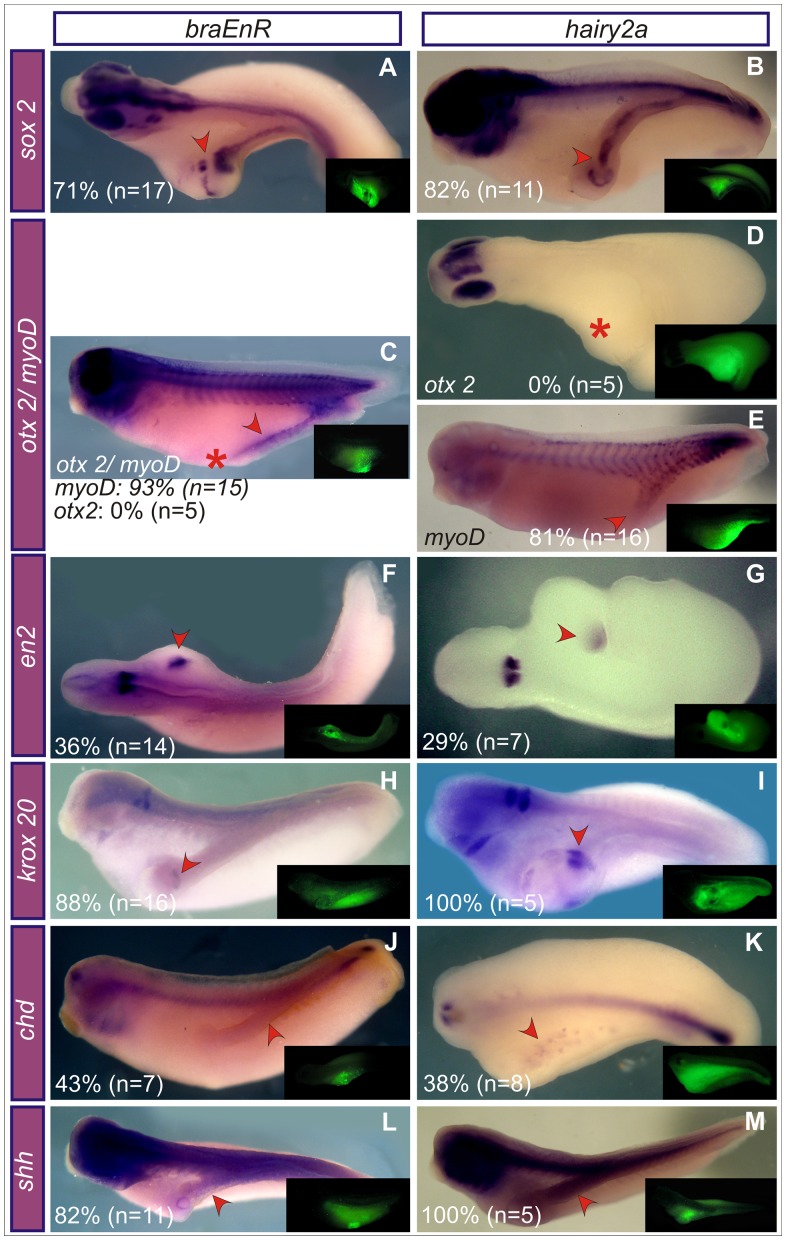
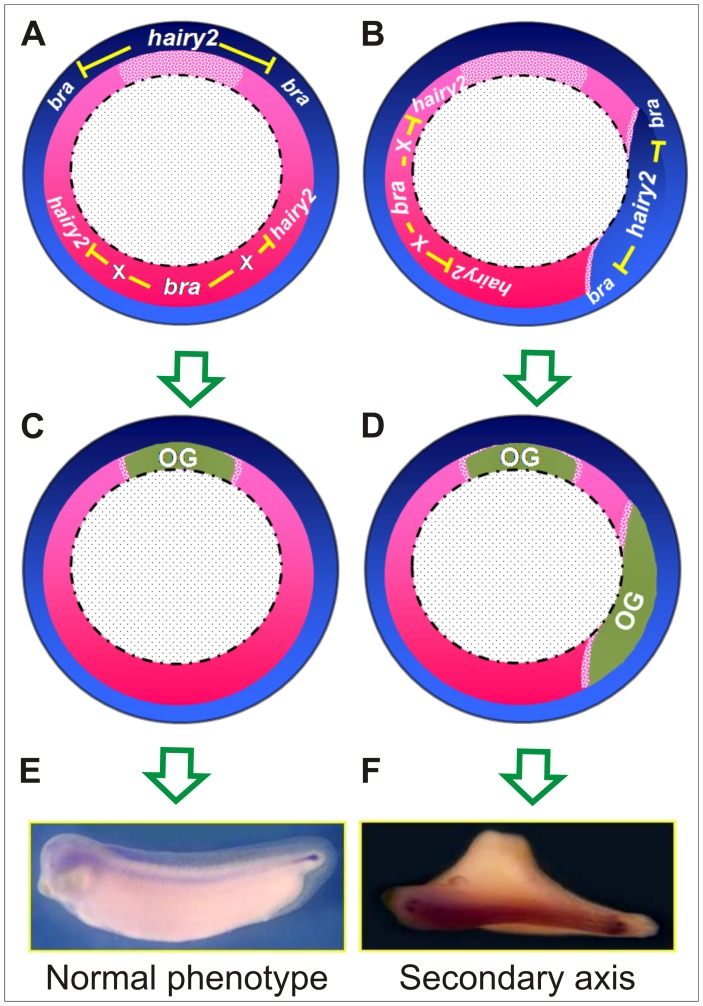
We have previously shown that the member of the HES family hairy2 induces the ectopic expression of dorsal markers when it is overexpressed in the ventral side of Xenopus embryos. Intriguingly, hairy2 represses the mesoderm transcription factor brachyury (bra) throughout its domain in the marginal zone. Here we show that in early gastrula, bra and hairy2 are expressed in complementary domains. Overexpression of bra repressed hairy2. Interference of bra function with a dominant-negative construct expanded the hairy2 domain and, like hairy2 overexpression, promoted ectopic expression of dorsal axial markers in the ventral side and induced secondary axes without head and notochord. Hairy2 depletion rescued the ectopic dorsal development induced by interference of bra function. We concluded that an intact bra function is necessary to exclude hairy2 expression from the non-organiser field, to impede the ectopic specification of dorsal axial fates and the appearance of incomplete secondary axes. This evidence supports a previously unrecognised role for bra in maintaining the dorsal fates inhibited in the ventral marginal zone, preventing the appearance of trunk duplications.


Conflict of interest statement

Competing Interests: The authors have declared that no competing interests exist.

Figures

Figure 1
Figure 1. Bra and hairy2 establish complementary expression domains.
Distribution of hairy2 (A,D,G, blue purplish; C,F,J,K, magenta; I,L, turquoise) and bra transcripts (B,E,H, blue-purplish; C,F,J,K, turquoise; I,L, magenta). For double ISHs, the name of each probe is written with the colour corresponding to the substrate with which it was revealed. Stage 9.5 (A–C), 10.25 (D–F), and 10.5 (G–L). (A–F,J,K) ISH in bisected embryos. The animal side is oriented to the top. d: dorsal side, v: ventral side. In C–F and J, the embryos were bisected in the sagittal plane, as represented by the broken black line in L. In K, the embryo was cut in a para-sagittal plane, as represented by the broken white line in L. Two halves of the same embryo are shown in the pairs A,B and D,E. The photographs in A,D were flipped 180° to facilitate comparison with the corresponding contralateral hemisection shown in B,E, respectively. Red arrows in A,B,D,E point to the overlapping of bra and hairy2 expression in the MZ. Yellow arrows in D,E mark the incipient blastopore dorsal lip. White asterisks in F,J indicate the overlapping of hairy2 and bra expression on the dorsal side. In J, the white, black and yellow arrowheads point to the prechordal mesoderm, the dorsal NIMZ, and the posterior, pre-involuted axial mesoderm, respectively. (G–I) Whole embryos in vegetal views. Dorsal is oriented to the top. The red broken line demarcates the blastopore. Yellow arrowheads in G point to the NIMZ. The arc between green arrows in G–I,L corresponds to the organiser region, with higher levels of hairy2 (G,I,L) and lower levels of bra expression (H,I,L). (L) Dorsal view of the same embryo shown in I.
Figure 2
Figure 2. Hairy2 restricts the bra domain.
(A–D) Distribution of bra transcripts (blue-purplish) at stage 10.5. Turquoise staining corresponds to chordin (chd) transcripts in the organiser. Embryos were injected into a ventral (A,B,E,G) or dorsal (C,D,E–G) cell at the 4-cell stage with 1.25 ng (C,E), 2.5 ng (A,E–G), or 5 ng (E,G) of control MO; 1.25 ng (D,E), 2.5 ng (B,E–G), or 5 ng (E,G) of hairy2a MO; 1.25 ng (E), 2.5 ng (E,G), or 5 ng (E,G) of hairy2b MO, or with a mix containing 2.5 ng of hairy2a MO +2.5 ng of hairy2b MO (G). DOG fluorescence (insets) indicates the injected side. (A,B) Whole embryos in vegetal views. Dorsal is oriented to the top. (C,D) Dorsal views of gastrulae showing bra and chd expression in the MZ. The green arrows in B,D point to up-regulations or domain expansions of bra. White bars in B,D indicate the width of the bra domain. (E) Percentage of embryos with bra expansion in the MZ. Comparison between different doses of control MO (blue line), hairy2b MO (pink line) and hairy2a MO (orange line). See Table 1. (F) Percentage of embryos displaying the arc of low bra expression that is normally observed in the organiser region (blue) or with an increase of bra expression in the organiser (light orange). (G) Percentage of embryos with bra expansion in the MZ. Comparison between the simultaneous knock-down of hairy2a and hairy2b and different doses of control MO, hairy2a MO, and hairy2b MO. n indicates the total number of injected embryos.
Figure 3
Figure 3. Bra restricts hairy2 expression.
Distribution of hairy2 at gastrula (A–D,G,H) and neural plate stage (E,F). Embryos were injected into a ventral (B,F,H) or dorsal cell (C,D) at the 4-cell stage with 1 ng of braEnR mRNA (B–D,F) or with 1 ng of bra mRNA (H). DOG fluorescence (left insets) indicates the injected side. The upper right inset in F shows an embryo injected into a dorsal cell at the 4-cell stage with 1 ng of braEnR mRNA with its corresponding DOG image at the left. Embryos in B–D, F, and H were fixed when sibling controls as shown in A,E, and G reached stage 11.5, 14, and 10.5, respectively. Embryos are shown in vegetal (A,B,D,G,H), dorsal (C), and posterior-dorsal views (E,F). Yellow asterisks mark the normal expression domain of hairy2 in the organiser region (A–D,G,H) or in the DML (E). Black arrowheads point to the hairy2 subdomains demarcating the neural plate border. The black broken line demarcates the blastopore. The green arrows point to ectopic expression of hairy2. Comparison of the distance from the blastopore to the vegetal border of the hairy2 domain between the injected and the non-injected sides (yellow bars) show the vegetalward expansion of hairy2 expression. Red arrows point to down-regulation of hairy2.
Figure 4
Figure 4. Ectopic induction of DML markers after interfering with bra function or overexpressing hairy2a.
(A,C,E) Uninjected sibling controls. Embryos were ventrally injected into one cell at the 4-cell stage with 1 ng of braEnR (B,B’,D,D’,F,F’,G) or of hairy2a mRNAs (G). Expression of chd (A,B,G), foxA4a (C,D,G) and not I (E–G) at stage 10.5. The injected side was detected by DOG fluorescence (B’,D’,F’). Green arrows point to the ectopic expression of the analysed markers. At this stage, the markers analysed are normally expressed only in the organiser –. (G) Percentage of gastrulae ventrally injected with braEnR (blue bars) or hairy2a mRNAs (light orange bars) expressing ectopic chd, foxA4a, and not I (chd: 100%, n = 26; foxA4a: 100%, n = 14; not I: 79%, n = 11/14, for braEnR; chd: 92%, n = 23/25; foxA4a: 80%, n = 8/10; not I: 60%, n = 3/5, for hairy2a).
Figure 5
Figure 5. Effects of braEnR on morphogenesis and on DML markers at neurula stage.
Ventral injections in one cell at the 4-cell stage with 1 ng of braEnR mRNA +10 ng of DOG (B–C’,E–F’,H–I’,K–L’). Expression of foxA4a (A–C), shh (D–F), not I (G–I), and chd (J–L), when control embryos reached stage 14 (A,D,G,J). At this stage, these markers are normally expressed in the DML –. Arrows point to the dorsal axis. Yellow arrowheads point to cells expressing ectopic DML markers. Injected embryos are shown with the corresponding fluorescence image at the right (DOG) to identify the descendants of the injected cells. Embryos were classified into phenotypes A and B according to the grade of anterior-posterior extension of the dorsal axis. Embryos are shown in dorsal (A,D,G,J), posterior-dorsal (B,E,H) or posterior (C,F,I,K,L) views. The percentages of embryos displaying each phenotype are indicated in B,C,E,F,H,I,K,L. For each marker, % A+B indicates the percentage of affected embryos (A plus B phenotypes) and N, the total number of embryos analysed.
Figure 6
Figure 6. Opposite regulation of chd by hairy2a or braEnR depending on the D
V context. Ventral (A,E) or dorsal (I) injections of 1 ng of braEnR mRNA into one cell at the 4-cell stage. E corresponds to a high-power view of the embryo shown in A. Embryos were fixed when sibling controls reached stage 14 (A) or 11 (I). Red arrows in A,I indicate the descendants of the injected cells. In A, we made use of the myc-tag epitopes fused to the braEnR construct to reveal the distribution of the encoded recombinant protein (brown dots). The injections in I included 10 ng of DOG (inset). Embryos are shown in posterior (A), vegetal (B–D,F–I) or vegetal and dorsal (J) views. (B–D,F–H,J–L) Analysis of chd expression when sibling controls (J) reached stage 11 in ventralised (B–D) or dorsalised (F–H) embryos, which were left uninjected (B,F) or were injected with 1 ng of hairy2a (C,G,K,L) or of braEnR mRNAs (D,H,K,L) before the first cleavage. Yellow asterisks mark the gaps of chd-negative cells. (K) Percentage of embryos expressing (light orange bars) or not expressing (blue bars) chd. UV-irradiated, uninjected embryos (UV) showed complete loss (67%) or very weak expression (37%) of chd (n = 88). Chd was expressed in 80% or 87% of UV-irradiated embryos injected with 1 ng of braEnR (braEnR/UV, n = 55) or of hairy2a mRNAs (hairy2a/UV, n = 96), respectively. (L) Percentage of embryos with asymmetric (blue bars) or radially symmetric chd expression (light orange bars) around the blastopore. The maximum effect of LiCl alone was found in 50% of embryos, which showed complete radial chd expression (LiCl, n = 53). Chd expression decreased in 88% or 100% of dorsalised embryos that were injected with 1 ng of braEnR (braEnR/LiCl; n = 41) or of hairy2a mRNAs (hairy2a/LiCl, n = 23), respectively.
Figure 7
Figure 7. Effects of ventral injections of braEnR and hairy2a mRNAs.
(A,B) Ventral injections into one ventral cell at the 4-cell stage produced spina bifida. (C) Mesodermal fate map of the blastomeres of the 16-cell-stage embryo (modified from [58]). Notochord (pink), somites (light blue), ventral blood islands (VBIs, light violet), Spemann’s organiser (SO). Green dots indicate the injection sites. (D–G) Ventral injections as in C occasionally induced small bumps (arrows, D,E) and tail-like structures (arrows, F,G). Embryos shown in D–G were hybridised with a sox2 probe. (H) Percentage of embryos with secondary axes+protuberances. Comparison between different doses of braEnR mRNA injected into the AB3 (blue), AB4 (pink), CD3 (yellow) or CD4 (light blue) blastomere. (I) Percentage of embryos with secondary axes classified according to the injected blastomere. The bars correspond to braEnR (blue) or hairy2a (light orange) mRNAs injections. Injections included nuc-lacZ mRNA (A,B) or DOG (D–G) as lineage tracers. Embryos were fixed when sibling controls reached stage 28 and are shown in dorsal (A,B,D,G), dorso-lateral (E) or lateral (F) views. The amounts of mRNA injected are indicated in each figure.
Figure 8
Figure 8. Characterisation of the secondary axes induced by braEnR or hairy2a.
A–M: Ventral injections into one cell at the 16-cell stage with 1 ng of braEnR (A,C,F,H,J,L) or of hairy2a mRNAs (B,D,E,G,I,K,M). Expression of sox2 (A,B), otx2 (C,D), myoD (C,E), en2 (F,G), krox20 (H,I), chd (J,K), and shh (L,M) at stage 28. For shh, embryos were overstained to preserve color during histological procedures. The injected side was detected by DOG fluorescence (insets). Red arrowheads point to the expression of different markers in the secondary axes. The red asterisk in C,D indicates the absence of otx2 expression in the secondary axis. The frequency for each marker is shown as percentage of the total number (n) of secondary axes analysed with the corresponding probe. Sox2 is a general neural marker . Otx2 is normally expressed in the eyes and forebrain . MyoD marks the somitic mesoderm –; en2, the midbrain-hindbrain boundary ; krox20, the third and fifth rhombomeres ; and chd and shh, the DML (see text for details). Embryos are shown with the primary axis in dorsal (A,D,F,G,K), dorso-lateral (L,M) or lateral (B,C,E,H,I,J) views.
Figure 9
Figure 9. Histological analysis of secondary axes induced by braEnR.
Expression of sox2 (A,A’), shh (B,B’), chd (C,C’) or myoD (D,D’). A’,A’’;B’,B’’;C’,C’’; D’,D’’ are transverse sections of the embryos shown in A,B,C,D, respectively. The yellow broken lines show the plane of the sections. (A’’,B’’,C’’,D’’) Nuclear Hoescht staining. The insets in A’ and B’ correspond to high-power views of the secondary neural tubes. Red arrows point to the secondary neural tube (A’,A’’,B’,B’’) or to the somites (D’,D’’) in the secondary axes. nc: notochord; nt: neural tube; s: somites.
Figure 10
Figure 10. BraEnR or hairy2a ventrally induce gsc and cer, but cannot consistently activate ectopic BCNE markers.
Ventral injections into one cell at the 4-cell stage with 1 ng of braEnR (B,E,I,L) or of hairy2a mRNAs (C,F,J,M). (A,D,H,K) Sibling controls. Expression of gsc (A–C) and cer (D–F) at stage 11. Expression of chd (H–J) and Xnr3 (K–M) at stage 9. Embryos are shown in vegetal (A–F), dorsal (H,K) or ventral views (I,J,L,M). Left insets in I,J,L,M are dorsal views of the embryos shown in the corresponding photography. The injected side was detected by DOG fluorescence (right insets). The green arrows point to the ectopic expression of the markers analysed. (G) Percentage of gastrulae ventrally injected with braEnR (blue bars) or hairy2a mRNAs (light orange bars) expressing ectopic gsc, and cer (gsc: 68%, n = 40/59; cer: 80%, n = 25, for braEnR; gsc: 100%, n = 25; cer: 83%, n = 30, for hairy2a). (N) Percentage of blastulae ventrally injected with braEnR mRNA (blue bars) or hairy2a mRNA (light orange bars), expressing ectopic chd or Xnr3 (chd: 75%, n = 23; Xnr3∶11%, n = 26, for braEnR; chd: 60%, n = 23; Xnr3∶10%, n = 51, for hairy2a).
Figure 11
Figure 11. Apoptosis in embryos injected with braEnR or hairy2a mRNAs occurs in the posterior region.
Embryos were injected with 1 or 2 ng of braEnR (C,J–K’’ and C,D–F, respectively) or with 1 or 2 ng of hairy2a mRNAs (C,L,M’’ and C,G–I, respectively) into one ventral cell at the 4-cell stage (1V/4 cells, C,D,G,J,J’,L,L’) or into the CD4 blastomere at the 16-cell stage (C,E,F,H,I,K–K’’,M–M’’). (A,B) uninjected sibling controls. Left inset in A corresponds to the dorsal view of the same embryo. TUNEL assays (A,C,D–I) or Lys staining (B,J–K’,L–M’) were performed at stage 14 or 28, respectively. (K’’,M’’) show ISH of sox2 in the same embryos shown in K,M, respectively, to reveal the secondary axis. Turquoise, orange and red arrowheads point to low, moderate or high levels of apoptosis, respectively. Left insets in D–I,J,K,L,M show the injected side revealed by DOG fluorescence. Arrows in K,K’’,M,M’’ point to secondary axes; white arrows in J’,L’ point to spina bifida, and in M’, to the unclosed blastopore. (J’,K’,L’,M’) merge of images shown in J,K,L,M, respectively. Embryos are shown in posterior (A,D–I) or lateral (B,J–M’’) views.
Figure 12
Figure 12. The effects of braEnR are mediated by hairy2.
A–F: Ventral injections in one cell at the 4-cell stage with braEnR mRNA plus the following MOs: control MO (A–C,F), hairy2a MO (C), hairy2b MO (C), or hairy2a+b MOs (C–F). Expression of chd at stage 10.5 (A,C,D) or stage 14 (B,E,F). The doses of injection are indicated in C,F. The injected side was determined by DOG fluorescence (insets). Red arrows point to the ectopic chd+ cells. Blue arrows indicate the location of the injection in rescued embryos. Embryos are shown in vegetal (A,D), posterior-dorsal (B) or dorsal (E) views. (C) Percentage of injected gastrulae expressing ectopic chd in the VLMZ. n: total number of injected embryos. (F) Percentages of injected neurulae showing normal morphology and chd expression (Normal phenotype), or Phenotype A or B (as in Fig. 4). Blue bars: embryos injected with braEnR mRNA plus control MO (n = 36). Light orange bars: embryos injected with braEnR mRNA plus hairy2a+b MOs (n = 31).
Figure 13
Figure 13. Bra maintains the embryonic dorsal-ventral pattern by repressing hairy2 in the MZ.
Diagrams of gastrulae in vegetal views. The black broken line represents the blastopore lip. (A,C,E) In control embryos, hairy2 is expressed in the NIMZ with maximum levels in the dorsal side (blue gradient), while bra is expressed in a more vegetal location, in the IMZ, with highest expression in the ventral region (pink gradient), while a gap of lower expression is observed in the organiser region (light pink). Through mutual antagonism, both genes establish complementary patterns and participate in a regulatory mechanism that ensures the normal development of the embryo (A). Thus, organiser specific genes (OG, green) are expressed only in the dorsal region (C) and the embryogenesis proceeds resulting in a normal larva (E). (B,D,F) However, if this equilibrium is perturbed and bra is inhibited in the VLMZ, hairy2 is derepressed, resulting in a vegetalward displacement of its domain (B), leading to the ectopic activation of OG in the VLMZ (D). This finally results in the establishment of a headless secondary axis without notochord (F). Bra should be acting indirectly, through the induction of a repressor of hairy2 (X).

References

    1. Dobrovolskaïa-Zavadskaïa N (1927) Sur la mortification spontanée de la queue chez la souris nouveau-née et sur l’existence d’un caractère heriditaire “nonviable”. C R Soc Biol 97: 114–116.
    1. Chesley P (1935) Development of the short-tailed mutant in the house mouse. J Exp Zool 70: 429–459.
    1. Gluecksohn-Schoenheimer S (1938) The Development of Two Tailless Mutants in the House Mouse. Genetics 23: 573–584. - PMC - PubMed
    1. Herrmann BG, Labeit S, Poustka A, King TR, Lehrach H (1990) Cloning of the T gene required in mesoderm formation in the mouse. Nature 343: 617–622. - PubMed
    1. Smith JC, Price BM, Green JB, Weigel D, Herrmann BG (1991) Expression of a Xenopus homolog of Brachyury (T) is an immediate-early response to mesoderm induction. Cell 67: 79–87. - PubMed

Publication types

MeSH terms

LinkOut - more resources