. 2013:3:1150.
doi: 10.1038/srep01150. Epub 2013 Jan 28.

Photostable fluorescent organic dots with aggregation-induced emission (AIE dots) for noninvasive long-term cell tracing

Affiliations

Photostable fluorescent organic dots with aggregation-induced emission (AIE dots) for noninvasive long-term cell tracing

Kai Li et al. Sci Rep. 2013.

Abstract

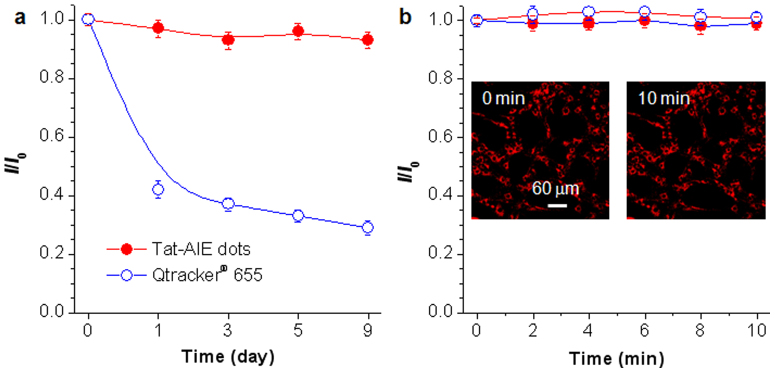
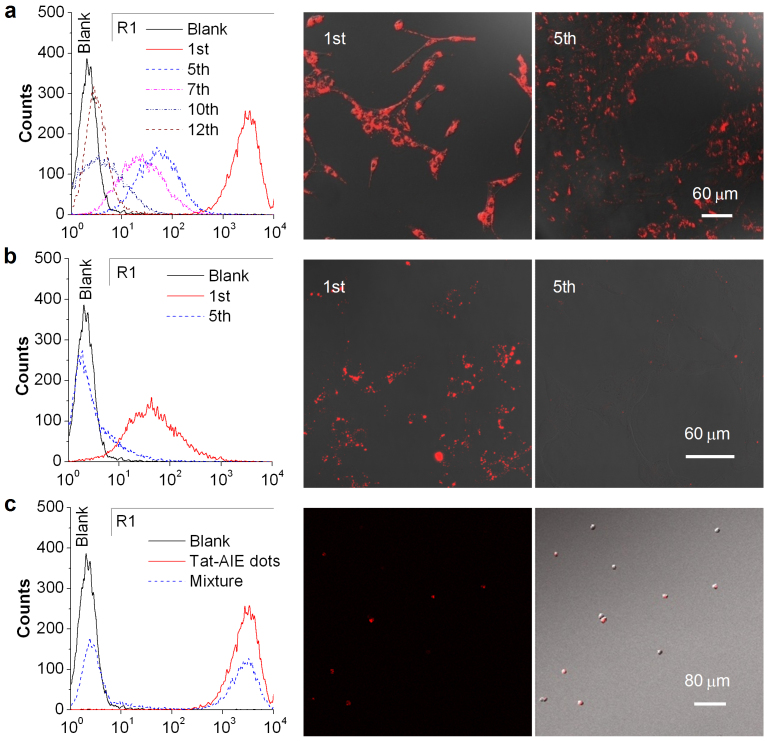
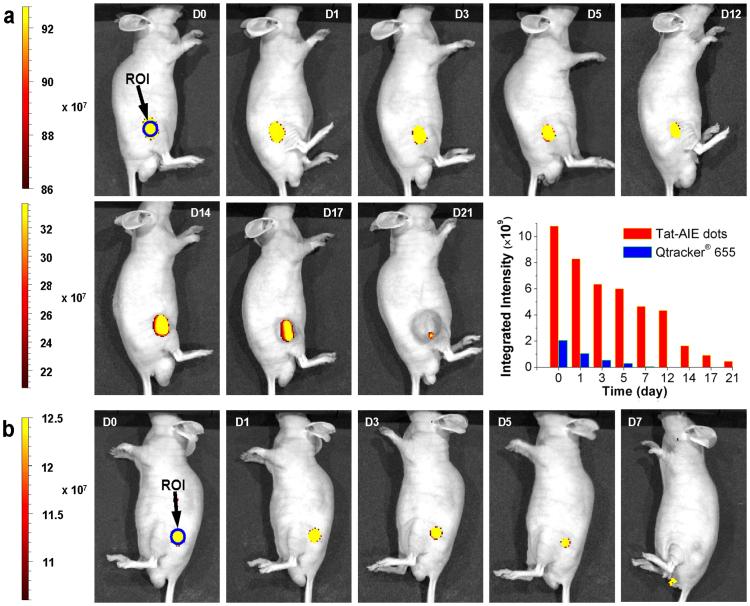
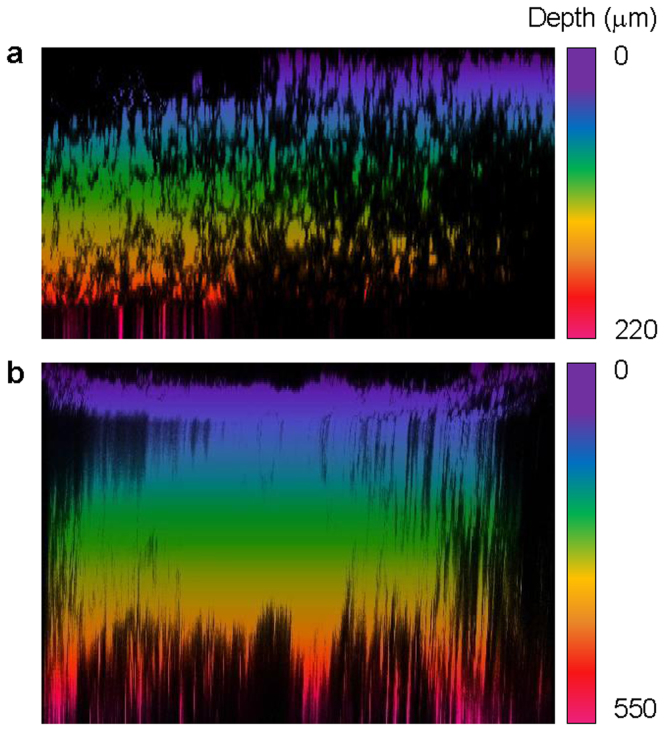
Long-term noninvasive cell tracing by fluorescent probes is of great importance to life science and biomedical engineering. For example, understanding genesis, development, invasion and metastasis of cancerous cells and monitoring tissue regeneration after stem cell transplantation require continual tracing of the biological processes by cytocompatible fluorescent probes over a long period of time. In this work, we successfully developed organic far-red/near-infrared dots with aggregation-induced emission (AIE dots) and demonstrated their utilities as long-term cell trackers. The high emission efficiency, large absorptivity, excellent biocompatibility, and strong photobleaching resistance of the AIE dots functionalized by cell penetrating peptides derived from transactivator of transcription proteins ensured outstanding long-term noninvasive in vitro and in vivo cell tracing. The organic AIE dots outperform their counterparts of inorganic quantum dots, opening a new avenue in the development of fluorescent probes for following biological processes such as carcinogenesis.


Figures

Figure 1
Figure 1. Structures and absorptivities of the luminogens used in this study.
(a and b) Chemical structures and molecular geometries of (a) TPAFN [an adduct of triphenylamine (TPA) and fumaronitrile (FN)] and (b) TPETPAFN [an adduct of tetraphenylethene (TPE) and TPAFN]; the molecular geometries were optimized by the DFT calculations using B3LYP/6-31G(d) basis set in Gaussian 03 program; hydrogen atoms were omitted for clarity. (c) Absorption spectra of TPAFN and TPETPAFN in tetrahydrofuran (THF) solutions with a concentration (c) of 1 μM.
Figure 2
Figure 2. Aggregation-induced emission (AIE).
(a and b) Photoluminescence (PL) spectra of (a) TPAFN and (b) TPETPAFN in THF/water mixtures with different water fractions (fw); c = 1 μM; excitation wavelength (λex): (a) 485 nm, (b) 500 nm. Insets: fluorescent photographs of (a) TPAFN and (b) TPETPAFN in THF (fw = 0%) and a THF/water mixture with fw = 90%. (c and d) Variations in I/I0 of (c) TPAFN and (d) TPETPAFN with fw. I0 and I are the PL intensities in THF (fw = 0) and a THF/water mixture with a specific fw, respectively. Insets: fluorescent photographs of powders of (c) TPAFN and (d) TPETPAFN; ΦF = fluorescence quantum yield.
Figure 3
Figure 3. Fabrication and characterization of organic Tat-AIE dots.
(a) Fabrication of Tat-AIE dots: i) Addition of a THF solution of TPETPAFN, 1,2-distearoyl-sn-glycero-3-phosphoethanolamine-N-[methoxy(polyethylene glycol)-2000] (DSPE-PEG2000) and its derivative end-capped by amino group (DSPE-PEG2000-NH2) into water under sonication affords amine-decorated core-shell organic dots with AIE characteristics (AIE dots); ii) Coupling of the amine-functionalized AIE dots with cell penetrating peptide yields Tat-AIE dots. (b) Particle size distribution and morphological structure of Tat-AIE dots studied by laser light scattering (LLS) and (inset) high-resolution transmission electron microscopy (HR-TEM). (c) Absorption and emission spectra of Tat-AIE dots suspended in water; λex = 510 nm.
Figure 4
Figure 4. Comparison of photophysical properties between organic Tat-AIE dots and Qtracker® 655.
Fluorescence Lifetime Imaging (FLIM, 5 × 5 μm2) results of (a) Tat-AIE dots and (b) Qtracker® 655, respectively. The images were acquired upon excitation with a pulsed laser at 467 nm with a long-pass filter above 505 nm. The image is modulated by the pixel intensity (total photon counts) and the false color scale corresponds to the fluorescence lifetime value at each pixel of the image. Bright spots visible on both images correspond to individual dots. Representative fluorescence time-traces of (c) an individual Tat-AIE dot (A) and (d) two Qtracker® 655 dots (B, grey trace and C, red trace) visible in (a) and (b), respectively. Experimental fluorescence decay curves of (e) Tat-AIE dots and (f) Qtracker® 655 in water. The red lines correspond to double exponential fits to the data and the black line is the instrument response function. τav is the average fluorescence lifetime calculated from the double exponential decay fits.
Figure 5
Figure 5. Stability of Tat-AIE dots.
(a) Time courses of PL intensity change of 2 nM Tat-AIE dots in DMEM with 10% fetal bovine serum at 37°C; data for quantum dots of Qtracker® 655 are shown for comparison. (b) Photobleaching resistance of Tat-AIE dots and Qtracker® 655 to the continuous irradiation by a laser beam (2 mW) at 514 nm. Insets: confocal images of the Tat-AIE dot-stained cells before (0 min) and after the laser irradiation for 10 min. I0 is the initial PL intensity, while I is that of the corresponding sample after a designated time interval.
Figure 6
Figure 6. Long-term tracing of living cells by Tat-AIE dots.
(a) and (b) Flow cytometry histograms of MCF-7 breast cancer cells after incubation with 2 nM (a) Tat-AIE dots and (b) Qtracker® 655 at 37°C for 4 h and then subcultured for designated generations. The untreated MCF-7 cells were used as the control (blank). The corresponding confocal images shown on the right were taken under excitation at 514 nm (~1 mW) with a 550–780 nm bandpass filter. (c) Flow cytometry histograms of the MCF-7 cells stained by 2 nM Tat-AIE dots at 37°C for 4 h (red solid line) and a mixture of Tat-AIE dot-stained MCF-7 cells and unstained cells (1:1; blue dashed line). The histograms were recorded after subculture for 1 day. The fluorescence image and fluorescence/transmission overlay image of the cell mixture are shown on the right.
Figure 7
Figure 7. In vivo fluorescence imaging of tumor cells by Tat-AIE dots.
(a) Representative in vivo fluorescence images of the mouse subcutaneously injected with 1 × 10⁶ of C6 glioma cells after staining by 2 nM Tat-AIE dots. (b) Data for Qtracker® 655 obtained under similar conditions. The images were taken on designated days post cell injection. The inset in the middle panel shows the integrated PL intensities of the regions of interest (blue circles) at the tumor sites from the corresponding images.
Figure 8
Figure 8. Depth profiles of fluorescence images of the tumor stained by Tat-AIE dots.
Color-coded projections of z-stacks of (a) one- and (b) two-photon excited fluorescence images indicate the depth of the tumor tissue that can be detected; (a) λex = 560 nm, (b) λex = 800 nm. The solid tumor was collected from the mouse after 9-day injection of the Tat-AIE dot-stained cells. The fluorescence signals were collected with a 550–780 nm bandpass filter.

References

    1. Ly H. Q., Frangioni J. V. & Hajjar R. J. Imaging in cardiac cell-based therapy: in vivo tracking of the biological fate of therapeutic cells. Nat. Clin. Pract. Cardiovasc. Med. 5, S96–S102 (2008). - PubMed
    1. Amado L. C. et al. Cardiac repair with intramyocardial injection of allogeneic mesenchymal stem cells after myocardial infarction. Proc. Natl. Acad. Sci. USA 102, 11474–11479 (2005). - PMC - PubMed
    1. Schächinger V. et al. Transplantation of progenitor cells and regeneration enhancement in acute myocardial infarction: Final one-year results of the TOPCARE-AMI Trial. J. Am. Coll. Cardiol. 44, 1690–1699 (2004). - PubMed
    1. Ebert S. N. et al. Noninvasive tracking of cardiac embryonic stem cells in vivo using magnetic resonance imaging techniques. Stem Cells 25, 2936–2944 (2007). - PubMed
    1. Doubrovin M. M. et al. In vivo imaging and quantitation of adoptively transferred human antigen-specific T cells transduced to express a human norepinephrine transporter gene.Cancer Res. 67, 11959–11969 (2007). - PubMed

Publication types

Substances