. 2013 Mar 5;110(10):3949-54.
doi: 10.1073/pnas.1202894110. Epub 2013 Jan 28.

The steady-state mosaic of disturbance and succession across an old-growth Central Amazon forest landscape

Affiliations

The steady-state mosaic of disturbance and succession across an old-growth Central Amazon forest landscape

Jeffrey Q Chambers et al. Proc Natl Acad Sci U S A. .

Abstract

Old-growth forest ecosystems comprise a mosaic of patches in different successional stages, with the fraction of the landscape in any particular state relatively constant over large temporal and spatial scales. The size distribution and return frequency of disturbance events, and subsequent recovery processes, determine to a large extent the spatial scale over which this old-growth steady state develops. Here, we characterize this mosaic for a Central Amazon forest by integrating field plot data, remote sensing disturbance probability distribution functions, and individual-based simulation modeling. Results demonstrate that a steady state of patches of varying successional age occurs over a relatively large spatial scale, with important implications for detecting temporal trends on plots that sample a small fraction of the landscape. Long highly significant stochastic runs averaging 1.0 Mg biomass⋅ha(-1)⋅y(-1) were often punctuated by episodic disturbance events, resulting in a sawtooth time series of hectare-scale tree biomass. To maximize the detection of temporal trends for this Central Amazon site (e.g., driven by CO2 fertilization), plots larger than 10 ha would provide the greatest sensitivity. A model-based analysis of fractional mortality across all gap sizes demonstrated that 9.1-16.9% of tree mortality was missing from plot-based approaches, underscoring the need to combine plot and remote-sensing methods for estimating net landscape carbon balance. Old-growth tropical forests can exhibit complex large-scale structure driven by disturbance and recovery cycles, with ecosystem and community attributes of hectare-scale plots exhibiting continuous dynamic departures from a steady-state condition.


Conflict of interest statement

The authors declare no conflict of interest.

Figures

Fig. 1.
Fig. 1.
A ∼100-km2 Central Amazon landscape shows a change in surface reflectance from (A) 2004 to (B) 2005, with patches exhibiting high short-wave infrared reflectance (red channel) indicative of disturbance across the entire image (green channel, near infrared) (B). After masking out (black pixels) all land use, rivers, roads, clouds, and areas with a high shade fraction (C), a mortality map (D) was generated based on a relationship between field-measured tree mortality and the ΔNPV remote-sensing metric. Tree mortality in this scene (D) demonstrated a variety of patch sizes ranging from isolated single-pixel disturbances, to large contiguous blowdown patches of ∼30 ha.
Fig. 2.
Fig. 2.
A Landsat-derived frequency distribution of total number of events (y) across a range of size classes (x), with the size of the patch calculated as the total number of dead trees in the patch using the relationship between ΔNPV and the fractional mortality rate (Fig. S3). The colored symbols indicate different Landsat image pairs used to calculate ΔNPV. Summed clusters across all five ΔNPV images were used to calculate a PDF for gaps larger than approximately eight trees per gap (SI Text).
Fig. 3.
Fig. 3.
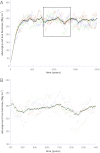
(A) The 100-ha output from a single 2,000-y run of TRECOS showing temporal changes in aboveground biomass averaged over 100 ha (large dark green symbols) compared with five randomly selected 1-ha plots from within the 100-ha domain. (B) In contrast to relatively stable average tree biomass at the 100-ha scale, single hectare plots exhibited relatively continuous departures from steady state. Hectare-scale plots often demonstrated long stochastic runs of biomass accumulation punctuated by episodic biomass loss events. Trend analysis of five single hectare output plots demonstrated long, highly significant trends in biomass gain averaging ∼1.0 Mg biomass⋅ha−1⋅y−1 (Fig. S3).
Fig. 4.
Fig. 4.
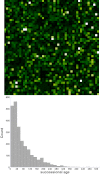
Spatial distribution in time since last episodic succession-inducing disturbance (te) estimated from TRECOS at the end of a 2,000-y run (light pixels, old patches; dark pixels, young patches). The distribution of te ranging from 1 to >500 y is shown in the histogram. Median te for the 400-m2 cells was 51 y (mean, 73.9 y), which is less than the time required for a patch to approach steady-state conditions in terms of biomass or tree species composition, resulting in a highly dynamic old-growth Central Amazon forest mosaic. Maximum te (534 y) demonstrated that a significant number of patches at the tail of this distribution are at a mature state, and trees exceeding 500 y are found in these forests (45).

Comment in

  • Geography of forest disturbance.
    Asner GP. Asner GP. Proc Natl Acad Sci U S A. 2013 Mar 5;110(10):3711-2. doi: 10.1073/pnas.1300396110. Epub 2013 Feb 20. Proc Natl Acad Sci U S A. 2013. PMID: 23426623 Free PMC article. No abstract available.

References

    1. Muller-Landau HC. Carbon cycle: Sink in the African jungle. Nature. 2009;457(7232):969–970. - PubMed
    1. Laurance WF, et al. Pervasive alteration of tree communities in undisturbed Amazonian forests. Nature. 2004;428(6979):171–175. - PubMed
    1. Phillips OL, et al. Increasing dominance of large lianas in Amazonian forests. Nature. 2002;418(6899):770–774. - PubMed
    1. Phillips OL, et al. Pattern and process in Amazon tree turnover, 1976–2001. Philos Trans R Soc Lond B Biol Sci. 2004;359(1443):381–407. - PMC - PubMed
    1. Baker TR, et al. Increasing biomass in Amazonian forest plots. Philos Trans R Soc Lond B Biol Sci. 2004;359(1443):353–365. - PMC - PubMed

Publication types