

Pancreatic tumors and immature immunosuppressive myeloid cells in blood and spleen: role of inhibitory co-stimulatory molecules PDL1 and CTLA4. An in vivo and in vitro study
- PMID: 23359812
- PMCID: PMC3554636
- DOI: 10.1371/journal.pone.0054824
Pancreatic tumors and immature immunosuppressive myeloid cells in blood and spleen: role of inhibitory co-stimulatory molecules PDL1 and CTLA4. An in vivo and in vitro study
Abstract
Background: Blood and spleen expansion of immature myeloid cells (IMCs) might compromise the immune response to cancer. We studied in vivo circulating and splenic T lymphocyte and IMC subsets in patients with benign and malignant pancreatic diseases. We ascertained in vitro whether pancreatic adenocarcinoma (PDAC)-associated IMC subsets are induced by tumor-derived soluble factors and whether they are immunosuppressive focusing on the inhibitory co-stimulatory molecules PDL1 and CTLA4.
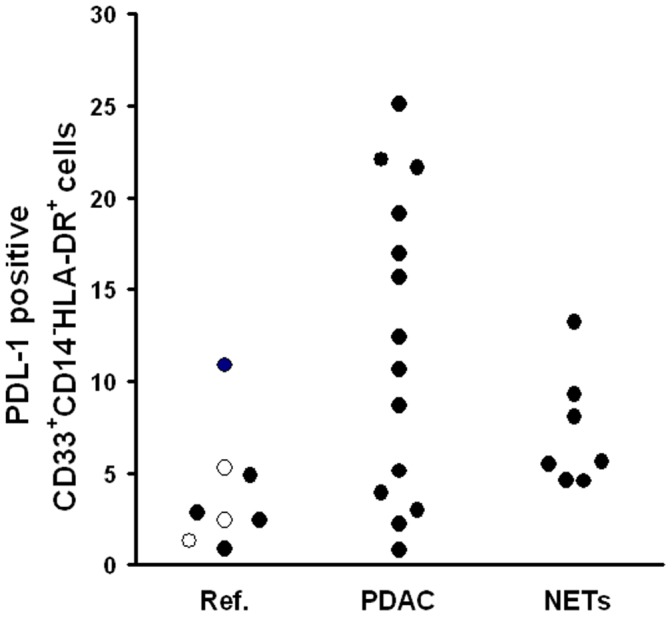
Methodology and principal findings: 103 pancreatic and/or splenic surgical patients were enrolled including 52 PDAC, 10 borderline and 10 neuroendocrine tumors (NETs). Lymphocytes and IMCs were analysed by flow cytometry in blood, in spleen and in three PDAC cell conditioned (CM) or non conditioned PBMC. PDL1 and CTLA4 were studied in 30 splenic samples, in control and conditioned PBMC. IMCs were FACS sorted and co-coltured with allogenic T lymphocytes. In PDAC a reduction was found in circulating CD8(+) lymphocytes (p = 0.004) and dendritic cells (p = 0.01), which were reduced in vitro by one PDAC CM (Capan1; p = 0.03). Blood myeloid derived suppressive cells (MDSCs) CD33(+)CD14(-)HLA-DR(-) were increased in PDAC (p = 0.022) and were induced in vitro by BxPC3 CM. Splenic dendritic cells had a higher PDL1 expression (p = 0.007), while CD33(+)CD14(+)HLA-DR(-) IMCs had a lower CTLA4 expression (p = 0.029) in PDAC patients. In vitro S100A8/A9 complex, one of the possible inflammatory mediators of immune suppression in PDAC, induced PDL1 (p = 0.018) and reduced CTLA4 expression (p = 0.028) among IMCs. IMCs not expressing CTLA4 were demonstrated to be immune suppressive.
Conclusion: In PDAC circulating dendritic and cytotoxic T cells are reduced, while MDSCs are increased and this might favour tumoral growth and progression. The reduced CTLA4 expression found among splenic IMCs of PDAC patients was demonstrated to characterize an immune suppressive phenotype and to be consequent to the direct exposure of myeloid cells to pancreatic cancer derived products, S100A8/A9 complex in particular.
Conflict of interest statement
Figures


References
-
- Klöppel G, Perren A, Heitz PU (2004) The gastroenteropancreatic neuroendocrine cell system and its tumors: the WHO classification. Ann N Y Acad Sci 1014: 13–27. - PubMed
-
- Hidalgo M (2010) Pancreatic cancer. N Engl J Med 362: 1605–1617. - PubMed
-
- Hanahan D, Weinberg RA (2011) Hallmarks of cancer: the next generation. Cell 144: 646–674. - PubMed
-
- Hiratsuka S, Watanabe A, Sakurai Y, Akashi-Takamura S, Ishibashi S, et al. (2008) The S100A8-serum amyloid A3-TLR4 paracrine cascade establishes a pre-metastatic phase. Nat Cell Biol 10: 1349–1355. - PubMed
-
- Basso D, Greco E, Padoan A, Fogar P, Scorzeto M, et al. (2011) Altered intracellular calcium fluxes in pancreatic cancer induced diabetes mellitus: Relevance of the S100A8 N-terminal peptide (NT-S100A8). J Cell Physiol 226: 456–468. - PubMed
Publication types
MeSH terms
Substances
LinkOut - more resources
Full Text Sources
Other Literature Sources
Medical
Research Materials
