. 2013 Mar;25(3):e233-44.
doi: 10.1111/nmo.12083. Epub 2013 Jan 29.

Altered neuronal density and neurotransmitter expression in the ganglionated region of Ednrb null mice: implications for Hirschsprung's disease

Affiliations

Altered neuronal density and neurotransmitter expression in the ganglionated region of Ednrb null mice: implications for Hirschsprung's disease

I Zaitoun et al. Neurogastroenterol Motil. 2013 Mar.

Abstract

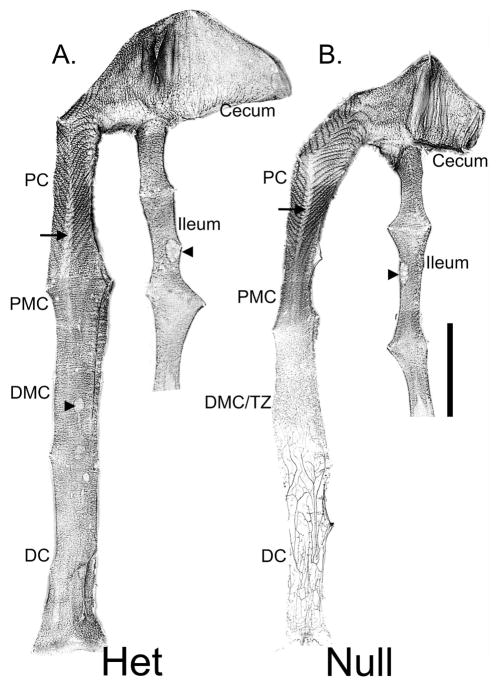
Background: Hirschsprung's disease (HSCR) is a congenital condition in which enteric ganglia, formed from neural crest cells (NCC), are absent from the terminal bowel. Dysmotility and constipation are common features of HSCR that persist following surgical intervention. This persistence suggests that the portion of the colon that remains postoperatively is not able to support normal bowel function. To elucidate the defects that underlie this condition, we utilized a murine model of HSCR.

Methods: Mice with NCC-specific deletion of Ednrb were used to measure the neuronal density and neurotransmitter expression in ganglia.

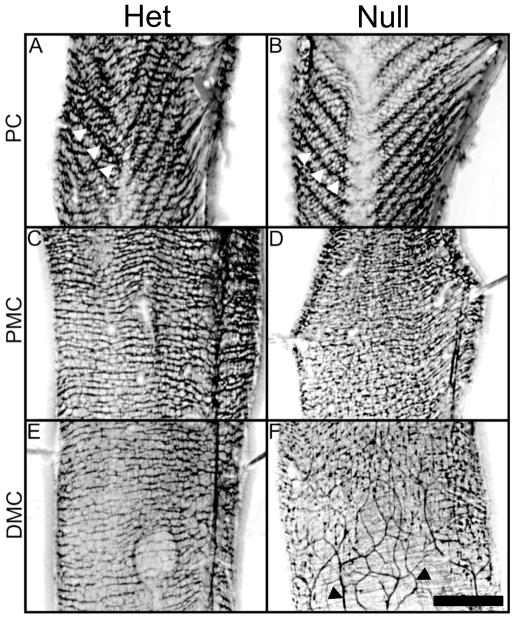
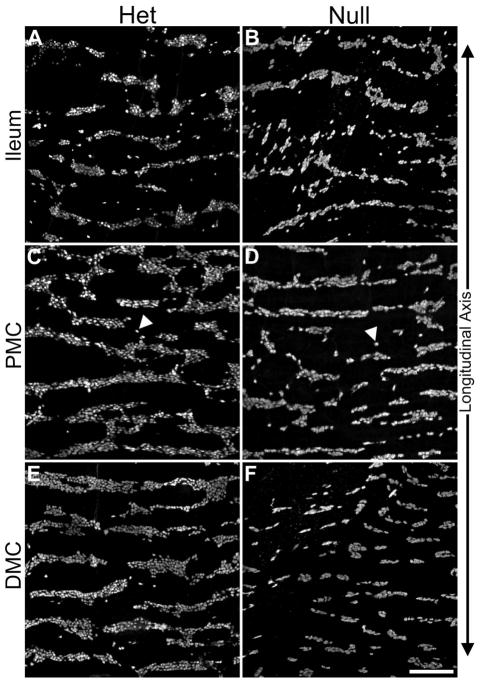
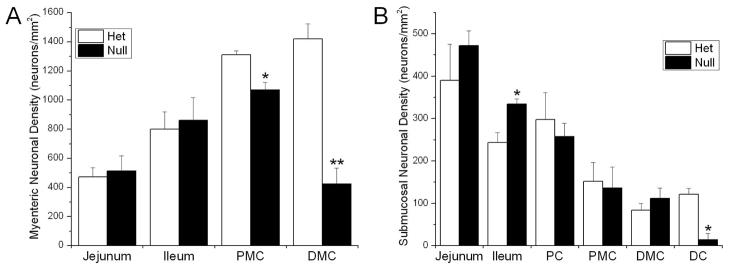
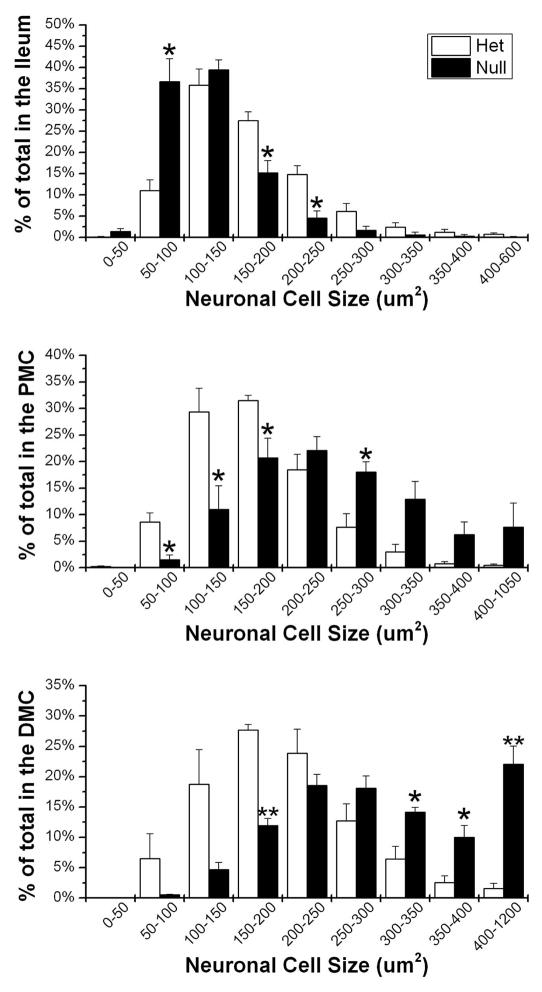
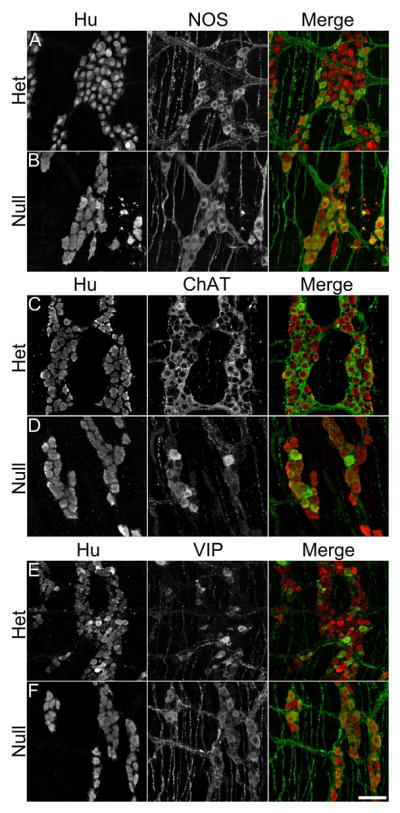
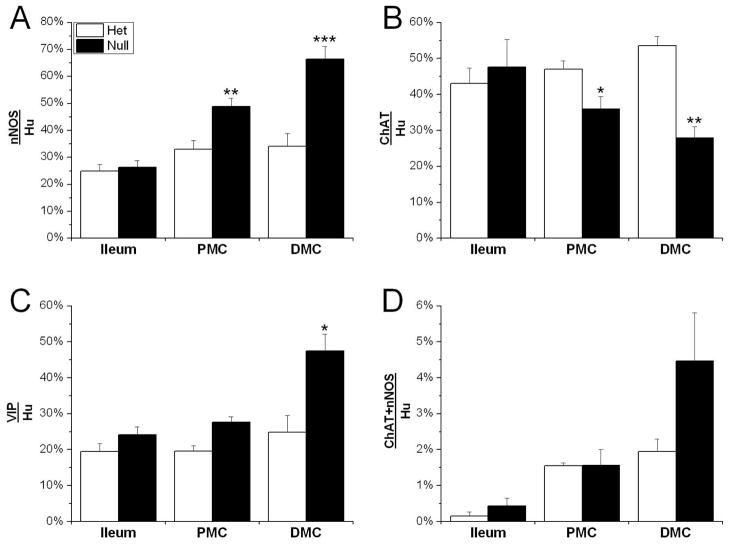
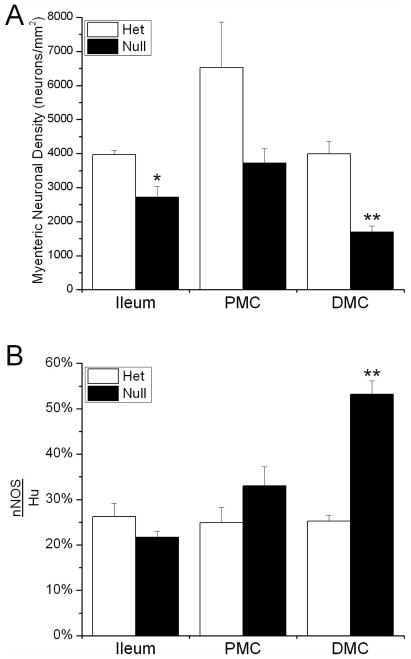
Key results: At the site located proximal to the aganglionic region of P21 Ednrb null mice, the neuronal density is significantly decreased and the expression of neurotransmitters is altered compared with het animals. The ganglia in this colonic region are smaller and more isolated while the size of neuronal cell bodies is increased. The percentage of neurons expressing neuronal nNOS and VIP is significantly increased in Ednrb nulls. Conversely, the percentage of choline acetyltransferase (ChAT) expressing neurons is decreased, while Substance P is unchanged between the two genotypes. These changes are limited to the colon and are not detected in the ileum.

Conclusions & inferences: We demonstrate changes in neuronal density and alterations in the balance of expression of neurotransmitters in the colon proximal to the aganglionic region in Ednrb null mice. The reduced neuronal density and complementary changes in nNOS and ChAT expression may account for the dysmotility seen in HSCR.


Conflict of interest statement

Conflicts of Interest

No competing interests declared.

Figures

Figure 1
Figure 1
Micrograph montage showing whole mount preparations of P21 Ednrb het (A) and null (B) distal ileum, cecum, and the entire colon. Circumferentially arranged ganglia are seen along the entire length of the bowel in the Ednrb het (A). Regions identified are ileum, cecum, proximal colon (PC), proximal mid-colon (PMC), distal mid-colon (DMC), and distal colon (DC). Ganglia appear as lines across the width of the colon. In the PC, the submucosal ganglia are arranged in a “V” shaped pattern, shown as dark lines, within the mucosal folds (see also, Supplementary Fig. 1). At the base of the “V”, the presence of ganglia is dramatically reduced (arrows). Note the Peyer’s Patch in the ileum and lymphoid follicles found in the colon (arrowheads). In the Ednrb null (B) ganglia are apparent in the PC and PMC, reduced in number in the DMC and almost completely absent in the DC which contains a significant number of sacral-derived nerve fascicles. The organization of ganglia in the proximal colon in the Ednrb null (B) is similar to the het (A). In the transition zone (TZ) ganglia are reduced in density and lack organization. Scale bar = 1 cm.
Figure 2
Figure 2
Micrographs made with a fluorescent dissecting microscope showing higher magnifications of portions of Figure 1. A, C, and E show P21 Ednrb het preparations and B, D, and F are Ednrb null. In the proximal colon (PC), (A and B), submucosal ganglia are arranged in a “V” shaped pattern (white arrowheads, see also Supplementary Fig. 1) while the myenteric ganglia appear as fine lines arranged horizontally across the width of the gut. Proximal mid-colon (PMC) of Ednrb het (C), and null (D) show similar patterns and density. Note that myenteric and submucosal ganglia cannot be distinguished from each other in these micrographs. Distal mid-colon (DMC) of Ednrb het (E) and null (F). Ganglia in the DMC are apparent in the Ednrb het but are reduced in number in the null. F shows the TZ and beginning of the aganglionic region in which sacral-derived nerve fascicles can be seen (black arrowheads). Scale bar = 2 mm.
Figure 3
Figure 3
Representative Z projection micrographs of Hu+ neurons in P21 myenteric ganglia in ileum, PMC, and DMC of Ednrb het (A, C, and E) and null (B, D, and F) animals. The size and number of ganglia in the ileum appears similar between the Ednrb het and null preparations (compare A and B). In the PMC (C and D), ganglia are reduced in size in the Ednrb null compared to the het. Also note the decrease in the width of the ganglia and the increase in number of single cells (arrowheads) distributed throughout the Ednrb null (D) in comparison to Ednrb het (C). The size of the ganglia in the Ednrb nullDMC (F) is substantially reduced with respect to the Ednrb het (E). Scale bar = 200 microns.
Figure 4
Figure 4
A. Density of P21 myenteric neurons in the jejunum, ileum, PMC, and DMC in Ednrb het and nullpreparations. The density is reduced to 80% in the Ednrb nullPMC and 30% in the DMC of that in the Ednrb het. B. Density of P21 submucosal neurons in the jejunum, ileum, PC, PMC, DMC, and DC in the Ednrb het and nullpreparations. The density is significantly reduced only in the ileum and DC of the Ednrb null. Note that cells found in the Ednrb null DC are of sacral origin. Only one out of nine samples showed the presence of neurons in the null DC. *p<0.05, **p<0.007.
Figure 5
Figure 5
Increased myenteric neuronal cell size in the colon of P21 Ednrb null animals. Bar graphs showing the percentage of Hu+ neurons ranging in size from 50–600μm2 in the ileum, 50–1050μm2 in the PMC, and 50–1200μm2 in the DMC of Ednrb het and null. In the ileum the majority of Ednrb null neurons show a reduction in size compared to hets. In contrast, in the PMC and DMC, Ednrb null animals contain a greater proportion of Hu+ neurons that are larger in size than those of the hets. Note the large increase of the proportion of neurons ≥ 400μm2. *p<0.05, **p<0.003.
Figure 6
Figure 6
Representative Z projection micrographs of nNOS (A, B), ChAT (C, D) and VIP (E, F) expression in Hu+ neurons in myenteric ganglia of Ednrb het and null DMC. Fewer Hu+ cells are present in the ganglion of Ednrb nulls (B) but a larger percentage contain nNOS expression which is also of greater intensity compared to Ednrb hets (A). Expression of ChAT in Hu+ neurons (C, D). Fewer Hu+ neurons expressing ChAT are present in the ganglion of the Ednrb null (D) compared to het (C). VIP expression in Hu+ neurons, following colchicine treatment (E, F). A larger percentage of the Hu+ neurons express VIP in Ednrb null preparations (F) compared to the hets (E). Note, that the Hu+ neurons are increased in size in Ednrb nulls compared to the hets. Scale bar = 50 microns.
Figure 7
Figure 7
Altered expression of nNOS, ChAT, and VIP in myenteric neurons of P21 Ednrb nulls compared to hets. Bar graphs showing the percentage of nNOS (A), ChAT (B), VIP (C) and nNOS/ChAT (D) in Hu+ neurons in the ileum, PMC, and DMC of P21 Ednrb het and null preparations. The percentage of nNOS expressing neurons is significantly increased in the PMC and DMC of Ednrb nulls in comparison to hets (A). These increases are correlated with decreased expression of ChAT (B). A significant increase in VIP expression was only detected in the DMC of Ednrb nulls when compared to hets (D). Only a very small proportion of Hu+ neurons co-express nNOS and ChAT which was increased in the DMC although this did not reach statistical significance (D). *p<0.05, **p<0.002, ***p<0.0001.
Figure 8
Figure 8
A. Density of Hu+ myenteric neurons in the P3 ileum, PMC, and DMC in Ednrb het and null preparations. The density of neurons is significantly reduced in the Ednrb null ileum and DMC compared to hets. B. The percentage of nNOS+ neurons in the P3 Ednrb het and null gut. The proportion of nNOS+ neurons is slightly increased in the Ednrb null PMC and significantly greater in the DMC compared to Ednrb hets. *p<0.05, **p<0.005.

Similar articles

Cited by

References

    1. Amiel J, Sproat-Emison E, Garcia-Barcelo M, et al. Hirschsprung disease, associated syndromes and genetics: a review. Journal Medical Genetics. 2008;45:1–14. - PubMed
    1. Kenny SE, Tam PK, Garcia-Barcelo M. Hirschsprung’s disease. Semin Pediatr Surg. 2010;19:194–200. - PubMed
    1. Parisi MA, Kapur RP. Genetics of Hirschsprung disease. Current Opinion In Pediatrics. 2000;12:610–7. - PubMed
    1. McCallion AS, Chakravarti A. EDNRB/EDN3 and Hirschsprung disease type II. Pigment Cell Res. 2001;14:161–9. - PubMed
    1. Heanue T, Pachnis V. Enteric nervous system development and Hirschsprung’s disease: advances in genetic and stem cell studies. Nat Rev Neurosci. 2007;8:466–79. - PubMed

Publication types

Substances