. 2013 Apr;161(1):43-56.
doi: 10.1111/bjh.12206. Epub 2013 Jan 30.

The Bruton tyrosine kinase (BTK) inhibitor PCI-32765 synergistically increases proteasome inhibitor activity in diffuse large-B cell lymphoma (DLBCL) and mantle cell lymphoma (MCL) cells sensitive or resistant to bortezomib

Affiliations

The Bruton tyrosine kinase (BTK) inhibitor PCI-32765 synergistically increases proteasome inhibitor activity in diffuse large-B cell lymphoma (DLBCL) and mantle cell lymphoma (MCL) cells sensitive or resistant to bortezomib

Girija Dasmahapatra et al. Br J Haematol. 2013 Apr.

Erratum in

  • Corrigendum.
    [No authors listed] [No authors listed] Br J Haematol. 2019 Mar;184(5):884-886. doi: 10.1111/bjh.15766. Br J Haematol. 2019. PMID: 30775794 No abstract available.

Abstract

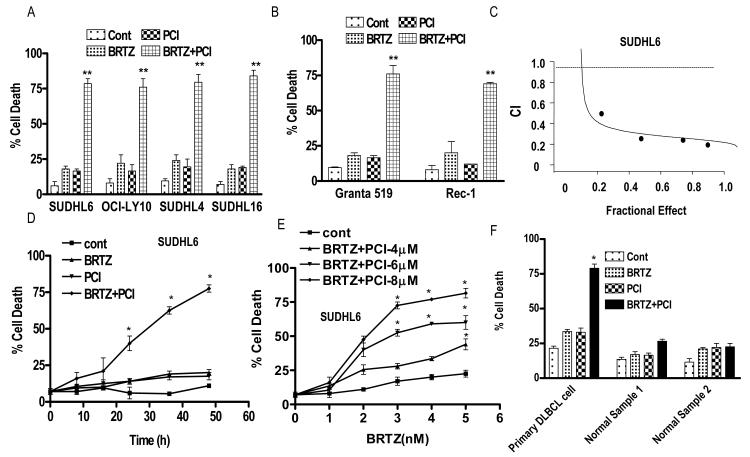
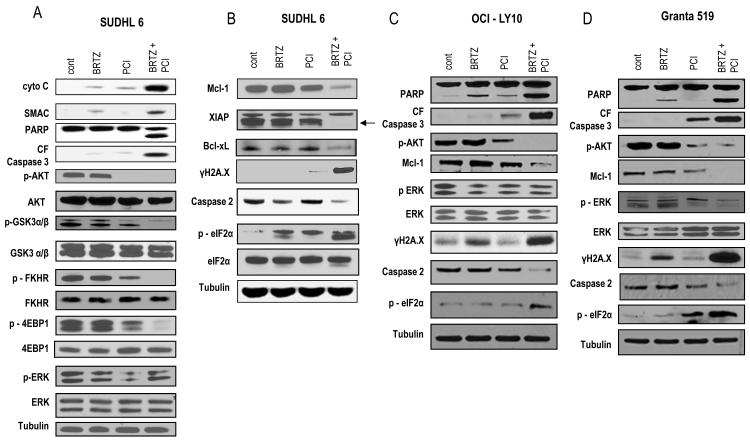
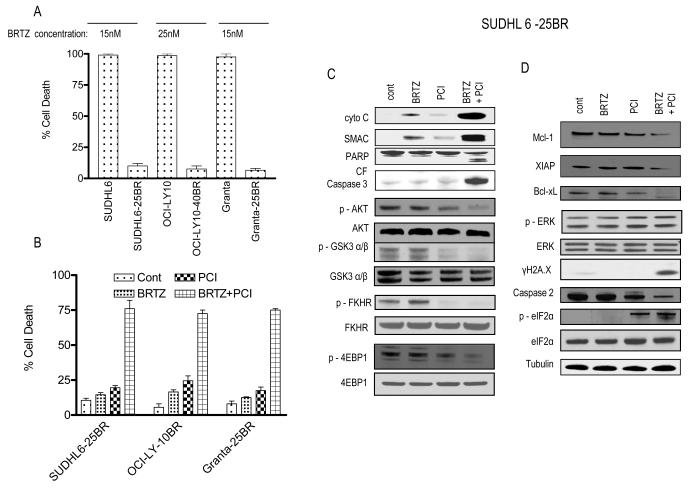
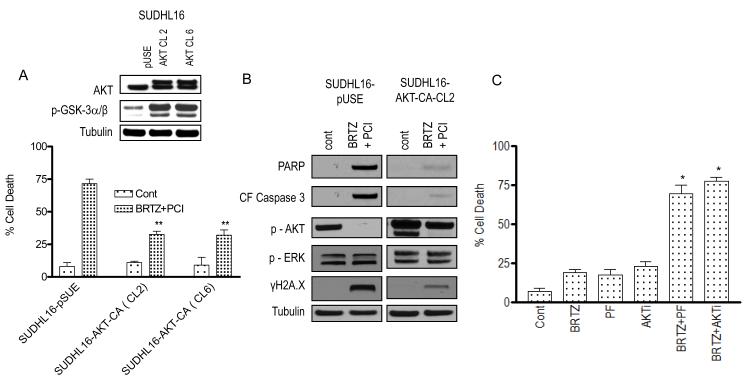
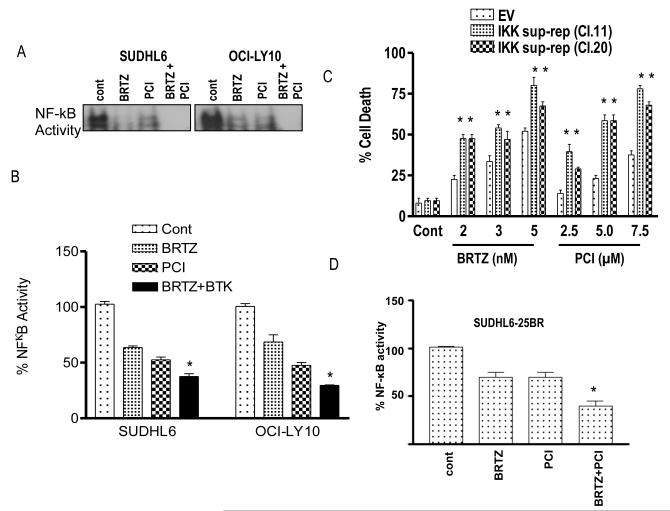
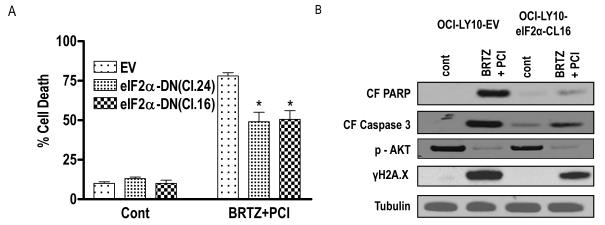
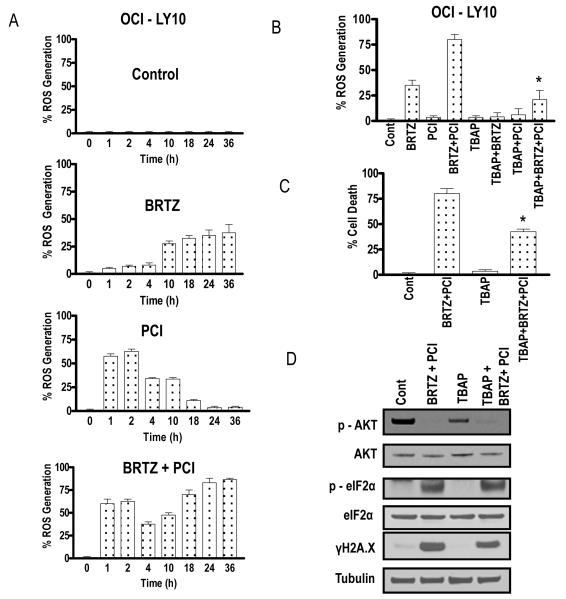
Interactions between the Bruton tyrosine kinase (BTK) inhibitor PCI-32765 and the proteasome inhibitor (bortezomib) were examined in diffuse large-B cell lymphoma (DLBCL) and mantle cell lymphoma (MCL) cells, including those highly resistant to bortezomib. Co-administration of PCI-32765/bortezomib synergistically increased mitochondrial injury and apoptosis in germinal centre- or activated B-cell-like-DLBCL cells and in MCL cells. These events were accompanied by marked AKT and nuclear factor (NF)-κB (NFKB1) inactivation, down-regulation of Mcl-1 (MCL1), Bcl-xL (BCL2L1), and XIAP, and enhanced DNA damage (e.g., γH2A.X formation) and endoplasmic reticulum (ER) stress. Similar interactions were observed in highly bortezomib-resistant DLBCL and MCL cells, and in primary DLBCL cells. In contrast, PCI-32765/bortezomib regimens displayed minimal toxicity toward normal CD34(+) bone marrow cells. Transfection of DLBCL cells with a constitutively active AKT construct attenuated AKT inactivation and significantly diminished cell death, whereas expression of an NF-κB "super-repressor" (IκBαser34/36 ) increased both PCI-32765 and bortezomib lethality. Moreover, cells in which the ER stress response was disabled by a dominant-negative eIF2α construct were resistant to this regimen. Finally, combined exposure to PCI-32765 and bortezomib resulted in more pronounced and sustained reactive oxygen species (ROS) generation, and ROS scavengers significantly diminished lethality. Given promising early clinical results for PCI-32765 in DLBCL and MCL, a strategy combining BTK/proteasome inhibitor warrants attention in these malignancies.


Figures

Figure 1
Figure 1. PCI-32765 and bortezomib interact synergistically in ABC or GC-DLBCL cells and MCL cells but not in normal cells
(A-B) Cells were treated with minimally toxic concentrations of bortezomib (SUDHL6 3 nM, OCI-LY10 8 nM, SUDHL4 5 nM, SUDHL16 2.5 nM, Granta 519 5 nM, Rec-1 15 nM) in the presence or absence of PCI (SUDHL6 7.5 μM, OCI-LY10 6 μM, SUDHL4 7.5 μM, SUDHL16 5.0 μM, Granta 519 7.5 μM, Rec-1 7.5 μM) for 48 h, after which cell death was monitored by 7-AAD staining and flow cytometry (C) Fractional Effect values were determined by comparing results obtained for untreated controls and treated cells following 48-h exposure to agents administered at a fixed ratio (bortezomib:PCI, 1:2500), after which Median Dose Effect analysis was employed to characterize the nature of the interaction. Combination Index (CI) values less than 1.0 denote a synergistic interaction. (D) SUDHL6 cells were treated with bortezomib 3.0 nM ± PCI 7.5 μM for different time intervals, after which cell death was monitored by flow cytometry and 7-AAD staining. (E) SUDHL6 cells were treated with varying PCI (4-8 μM) concentrations in the presence or absence of fixed concentrations of bortezomib (1.0 or 5.0 nM) for 48 h, after which cell death was monitored by flow cytometry and 7-AAD staining (F) Primary human DLBCL (GC subtype) mononuclear cells (96% purity) were isolated as described in Methods and re-suspended in medium containing 10% fetal calf serum at a cell density of 0.75 × 10⁶/ml cells. They were then treated with bortezomib (4 nM) ± PCI32765 (6.0 μM) for 10 h. CD34+ cells were collected from the bone marrow, isolated by an immunomagnetic bead separation technique as described in Methods, and exposed to bortezomib ± PCI as indicated for 48 h. Cell death was monitored by Annexin V/propidium iodide staining. For all studies, values represent the means for 3 experiments performed in triplicate ± S.D. For A-B ** = significantly more than values obtained for bortezomib or PCI treatment alone < 0.02. D-F, * = significantly greater than values obtained for bortezomib or PCI treatment alone in SUDHL6 cells or primary DLBCL cells; P < 0.05. Cont, control; BRTZ, bortezomib; PCI, PCI-32765.
Figure 2
Figure 2. Co-exposure of DLBCL or MCL cells to PCI-32765 and bortezomib leads to modulation of multiple survival and stress-related pathways
(A) SUDHL6 cells were treated for 24 h with bortezomib (3.0 nM) ± PCI (7.5 μM). (B) OCI-LY10 cells were treated for 24 h with bortezomib (8.0 nM) ± PCI (6.0 μM). (C) Granta cells were treated for 24 h with bortezomib (5.0 nM) ± PCI (7.5 μM). (A-C) Expression of the indicated proteins was determined by Western blotting using indicated antibodies. Each lane was loaded with 20 μg of protein; blots were stripped and re-probed with antibodies to tubulin to ensure equivalent loading and transfer. Results are representative of three independent experiments. cont, control; BRTZ, bortezomib; PCI, PCI-32765.
Figure 3
Figure 3. PCI-32765 and bortezomib interact synergistically in bortezomib-resistant DLBCL and MCL cells
(A) Bortezomib-resistant SUDHL6-25BR, OCI-LY10-40BR, Granta-25BR cells and their parental counterparts were treated for 48 h with the indicated concentration of bortezomib, after which cell death was monitored by 7-AAD staining and flow cytometry. Results represent the means ± standard deviation for 3 separate experiments performed in triplicate. (B) SUDHL6-25BR, OCI-LY10-40BR, Granta-25BR cells were treated with minimally toxic concentrations of bortezomib and PCI. Concentrations were as follows: SUDHL6-25BR - bortezomib (15 nM) ± PCI (7.5 μM), OCI-LY10-40BR - bortezomib (25 nM) ± PCI (6.0 μM), Granta – 25BR - bortezomib (15 nM) ± PCI (7.5 μM). Cell death was monitored by 7-AAD after 48 h, as described above in A. (C-D) SUDHL6-25BR cells were exposed for 24 h to bortezomib and PCI as in (B), after which Western blot analysis was performed with the indicated antibodies. cont, control; BRTZ, bortezomib; PCI, PCI-32765.
Figure 4
Figure 4. AKT inactivation plays a significant functional role in PCI-32765/bortezomib synergism
SUDHL16 cells were stably transfected with constitutively active (myristolated) AKT constructs (AKT cl.2 and 6) or empty vector (pUSE), and exposed for 48 h to bortezomib (3.0 nM) ± PCI (5.0 μM), after which cell death was monitored by 7-AAD staining and flow cytometry. Results represent the means ± standard deviation (SD) for 3 separate experiments performed in triplicate. Inset: Western blots showing expression of AKT and p-GSK-3α/β in empty vector control and AKT clones. (B) Cells were treated as described above in (A) for 24 h, after which Western blot analysis was performed to monitor expression of the indicated proteins. Each lane was loaded with 20 μg of protein; blots were stripped and re-probed with antibodies to tubulin to ensure equivalent loading and transfer. Results are representative of three independent experiments. (C) SUDHL6 cells were treated for 48 h with bortezomib (3 nM) ± perifosine ( PF: 2.5 μM) or AKTi ( 500 nM) after which cell death was monitored by 7-AAD staining and flow cytometry. Results represent the means ± SD for 3 separate experiments performed in triplicate. For A, ** = significantly less than values obtained for bortezomib + PCI treatment in SUDHL16 cells expressing pUSE cells; P < 0.02. C, * = significantly more than values obtained for bortezomib, perifosine or AKTi treatment alone in SUDHL6 cell; P < 0.05. cont, control; BRTZ, bortezomib; PCI, PCI-32765.
Figure 5
Figure 5. Evidence for the contribution of inactivation of NF-κB to PCI-32765/bortezomib synergism
(A) SUDHL 6 and OCI-LY10 - DLBCL cells were treated with bortezomib (3.0-8.0 nM) ± PCI (6-7.5 μM) and for 24 h. Nuclear proteins were extracted using a nuclear extract kit (Active Motif) and then subjected to electrophoretic mobility shift assay (EMSA) gel shift assays to assess NF-κB DNA binding as described in Methods. (B) Using the same nuclear proteins, NF-κB activity was determined using an enzyme-linked immunosorbent assay (ELISA) TransAM NF-κB p65 Transcription Factor Assay Kit (Active Motif), as described in Methods. (C) SUDHL16-IKK super repressor cell (sup-rep) with empty vector control was treated with the indicated concentration of either bortezomib or PCI alone for 48 h and cell death was measured by 7AAD staining. (D) SUDHL 6-25BR cells were treated with bortezomib (15 nM) ± PCI (7.5 μM) for 24 h. Nuclear proteins were extracted using a nuclear extract kit (Active Motif) and NF-κB activity was determined using an ELISA TransAM NF-κB p65 Transcription Factor Assay Kit (Active Motif), as described in Methods. Values represent the means ± standard deviation of triplicate determinations for 3 separate experiments. For B & D * = significantly less than values for bortezomib or PCI alone; P < 0.05, For C ** = significantly greater than values for bortezomib or PCI alone than empty vector control; P < 0.05. cont, control; BRTZ, bortezomib; PCI, PCI-32765.
Figure 6
Figure 6. Role of ER stress in PCI-32765/bortezomib activity in DLBCL cells
(A) SUDHL16 cells stably transfected with an eIF2α-DN (CL.24 and Cl.16) or an empty vector (pcDNA3.1) construct were incubated with 2.5 nM bortezomib + 5.0 μM PCI. After 36-h of drug exposure, cell death was monitored by 7-AAD staining and flow cytometry. Values represent the means ± standard deviation for triplicate determinations for 3 separate experiments. (B) Following 16-h of drug exposure to SUDHL16-eIF2α cells and empty vector controls cells as described in (A) above, Western blot analysis was employed to monitor protein expression using the indicated antibodies. Blots were stripped and re-probed with anti-tubilin antibodies to ensure equal loading and transfer of protein (20 μg each lane). For A* = significantly less than values for control cells; P < 0.05. Two additional studies yielded equivalent results. cont, control; BRTZ, bortezomib; PCI, PCI-32765.
Figure 7
Figure 7. Combined exposure to PCI-32765 and bortezomib leads to oxidative injury-mediated cell death in DLBCL cells
(A) OCI-LY10 cells were treated with bortezomib (8.0 nM) ± PCI (6.0 μM) as above after which reactive oxygen species (ROS) generation was monitored at the indicated intervals (B) OCI-LY10 cells were treated with bortezomib (8.0 nM) ± PCI-6.0 μM (± pre-treatment with 400 μM TBAP for 3 h) for 24 h after which ROS generation was monitored as described in Methods. (C) After treatment as in (B) above for 48 h, cell death was monitored by 7AAD staining (D). Values represent the means ± standard deviation for triplicate determinations for 3 separate experiments. Following 24-h of drug exposure as in (C) above, expression of the indicated proteins was monitored by Western blotting. Blots were stripped and re-probed with anti-tubilin antibodies to ensure equal loading and transfer of protein (20 μg each lane). For B and C, * = significantly different from values for combination treatment without TBAP pretreatment controls, P < 0.05. cont, control; BRTZ, bortezomib; PCI, PCI-32765.

Comment in

  • Findings of Research Misconduct.
    [No authors listed] [No authors listed] NIH Guide Grants Contracts (Bethesda). 2015 Dec 18:NOT-OD-16-040. NIH Guide Grants Contracts (Bethesda). 2015. PMID: 26693581 Free PMC article. No abstract available.
  • Findings of Research Misconduct.
    [No authors listed] [No authors listed] Fed Regist. 2015 Dec 10;80(237):76703-76704. Fed Regist. 2015. PMID: 27737268 Free PMC article. No abstract available.

References

    1. Adams J, Palombella VJ, Sausville EA, Johnson J, Destree A, Lazarus DD, Maas J, Pien CS, Prakash S, Elliott PJ. Proteasome inhibitors: a novel class of potent and effective antitumor agents. Cancer Res. 1999;59:2615–2622. - PubMed
    1. An B, Goldfarb RH, Siman R, Dou QP. Novel dipeptidyl proteasome inhibitors overcome Bcl-2 protective function and selectively accumulate the cyclin-dependent kinase inhibitor p27 and induce apoptosis in transformed, but not normal, human fibroblasts. Cell Death.Differ. 1998;5:1062–1075. - PubMed
    1. Balbasubramanian S, Crowley S, Sirisiwad M, Thiemann P, Chen J, Buggy J. The Bruton’s Tyrosine Kinase (BTK) Inhibitor PCI-32765 Inhibits Growth of ABC DLBCL Tumors In Vivo and in Vitro by Preventing Activation of Pro-Survival NF-{kappa}B pathways. Blood (ASH annual Meeting Abstracts) 2011;117:4969.
    1. Bea S, Zettl A, Wright G, Salaverria I, Jehn P, Moreno V, Burek C, Ott G, Puig X, Yang L, Lopez-Guillermo A, Chan WC, Greiner TC, Weisenburger DD, Armitage JO, Gascoyne RD, Connors JM, Grogan TM, Braziel R, Fisher RI, Smeland EB, Kvaloy S, Holte H, Delabie J, Simon R, Powell J, Wilson WH, Jaffe ES, Montserrat E, Muller-Hermelink HK, Staudt LM, Campo E, Rosenwald A. Diffuse large B-cell lymphoma subgroups have distinct genetic profiles that influence tumor biology and improve gene-expression-based survival prediction. Blood. 2005;106:3183–3190. - PMC - PubMed
    1. Bedford L, Lowe J, Dick LR, Mayer RJ, Brownell JE. Ubiquitin-like protein conjugation and the ubiquitin-proteasome system as drug targets. Nat.Rev.Drug Discov. 2011;10:29–46. - PMC - PubMed

Publication types

MeSH terms