. 2013 Apr;12(2):247-56.
doi: 10.1111/acel.12047. Epub 2013 Jan 30.

Genomes of replicatively senescent cells undergo global epigenetic changes leading to gene silencing and activation of transposable elements

Affiliations

Genomes of replicatively senescent cells undergo global epigenetic changes leading to gene silencing and activation of transposable elements

Marco De Cecco et al. Aging Cell. 2013 Apr.

Abstract

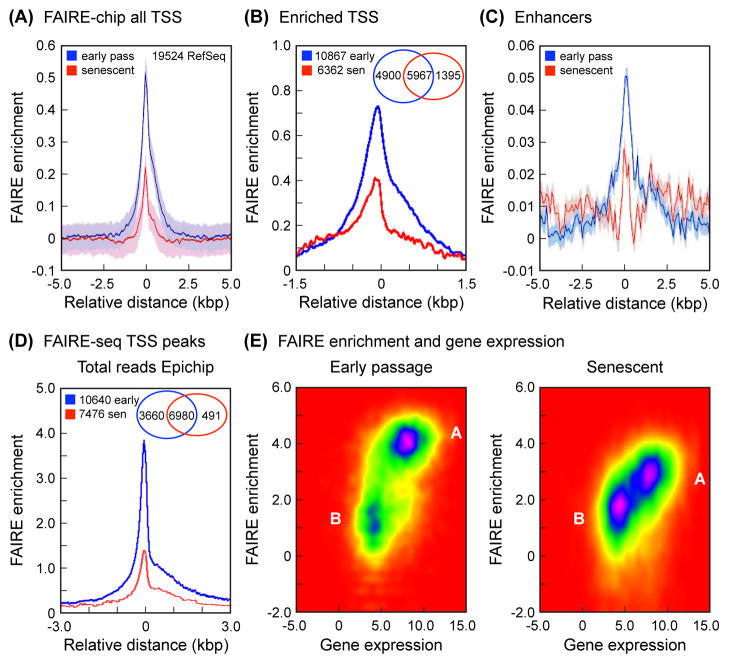
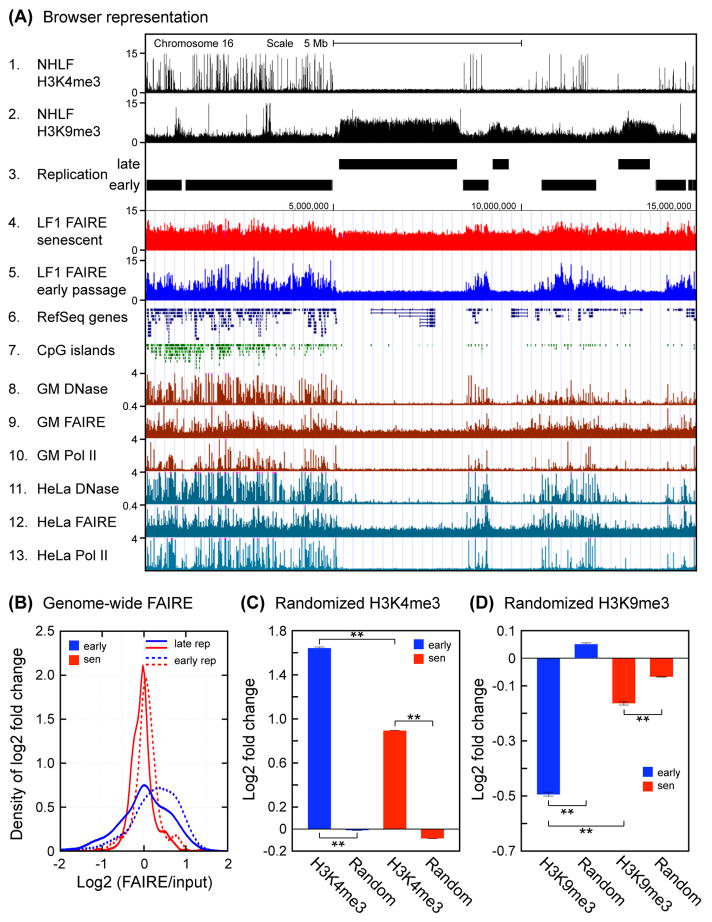
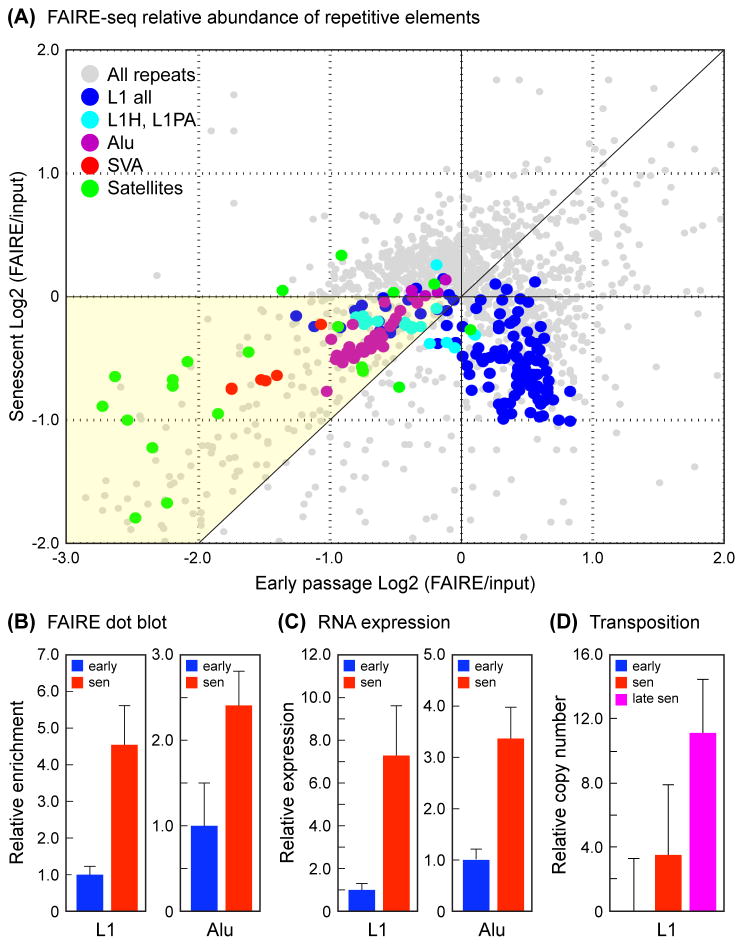
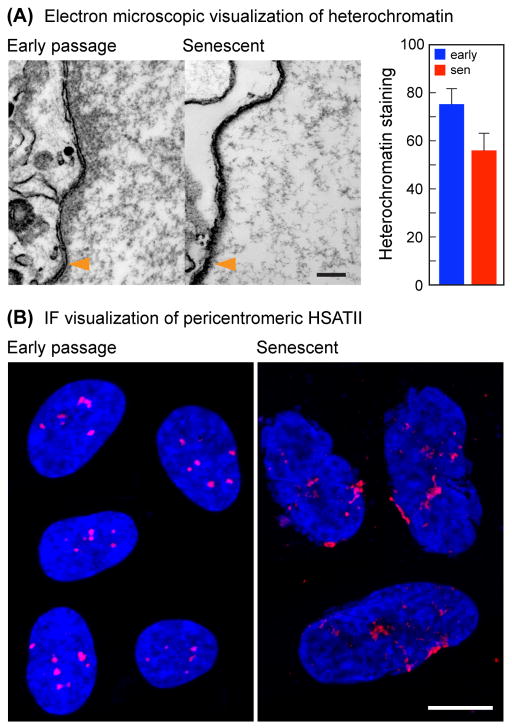
Replicative cellular senescence is an important tumor suppression mechanism and also contributes to aging. Progression of both cancer and aging include significant epigenetic components, but the chromatin changes that take place during cellular senescence are not known. We used formaldehyde assisted isolation of regulatory elements (FAIRE) to map genome-wide chromatin conformations. In contrast to growing cells, whose genomes are rich with features of both open and closed chromatin, FAIRE profiles of senescent cells are significantly smoothened. This is due to FAIRE signal loss in promoters and enhancers of active genes, and FAIRE signal gain in heterochromatic gene-poor regions. Chromatin of major retrotransposon classes, Alu, SVA and L1, becomes relatively more open in senescent cells, affecting most strongly the evolutionarily recent elements, and leads to an increase in their transcription and ultimately transposition. Constitutive heterochromatin in centromeric and peri-centromeric regions also becomes relatively more open, and the transcription of satellite sequences increases. The peripheral heterochromatic compartment (PHC) becomes less prominent, and centromere structure becomes notably enlarged. These epigenetic changes progress slowly after the onset of senescence, with some, such as mobilization of retrotransposable elements becoming prominent only at late times. Many of these changes have also been noted in cancer cells.


Figures

Fig. 1
Fig. 1
FAIRE analysis of TSS and enhancers. (A) FAIRE-chip: average FAIRE signal at TSS decreases in senescent cells. Enrichment (Y-axis) was calculated as the averaged log2 (FAIRE/input) signal for each probe within a 10 kbp window (X-axis) centered on all the selected TSS (corrected for background, which was calculated by interpolating over 530,000 random 5 kbp regions across the genome). The 19,524 RefSeq genes were selected from the 26,083 genes annotated in the hg18 build of the human genome because they contained unique TSS. The interpolated values are shown as a solid line (blue, early passage; red, senescent), and the shaded regions represent the standard deviation envelopes above and below the mean. (B) FAIRE-chip: signal at TSS partitions into 2 clusters and decreases in the enriched cluster in senescent cells. The analysis was performed using 2 clusters and a window of 3 kbp (see Experimental Procedures). Shown here is the FAIRE-enriched cluster, which contains 10,867 genes in early passage cells (blue) and 6,362 genes in senescent cells (red). Interpolated values are shown as in (A). The Venn diagram shows the distribution of genes in the FAIRE enriched cluster: 5,967 genes are enriched in both early passage and senescent cells, 4,900 genes are uniquely enriched in early passage cells, and 1,395 genes are uniquely enriched in senescent cells. (C) FAIRE-chip: enrichment at enhancers decreases in senescent cells. Enrichment was calculated as in (A) using a database of predicted enhancers (Heintzman et al., 2009) (see Experimental Procedures). (D) FAIRE-seq: average FAIRE signal at TSS decreases in senescent cells. All uniquely mapping reads were processed with EpiChIP software (Hebenstreit et al., 2011), using a window of 6 kbp centered on all the TSS in the human genome hg18 or hg19 annotation files. The FDR cutoffs for both signal and noise were set at 0.05. This analysis identified significant TSS peaks in 10,640 genes in early passage cells, and 7,476 genes in senescent cells. The Venn diagram shows the distribution of genes: 6,980 genes have peaks in both early passage and senescent cells, 3,660 genes have peaks only in early passage cells, and 491 genes have peaks only in senescent cells. (E) FAIRE-seq: positive correlation of FAIRE enrichment at TSS with gene expression in early passage (left) and senescent (right) cells. The FAIRE enrichment dataset was intersected with the Affymetrix gene expression dataset and visualized using EpiChIP software. FAIRE enrichment (Y-axis) is shown as reads per gene. Gene expression (X-axis) is shown as PLIER scores. Note that early passage cells contain two well demarcated clusters of genes, one (A) with higher FAIRE and gene expression signals, and one (B) with lower values for both. Cluster A is notably larger. In senescent cells, cluster A loses FAIRE enrichment, and cluster B becomes more prominent.
Fig. 2
Fig. 2
Large scale genome-wide distribution of FAIRE signals. (A) A genome browser view is shown for a representative 15 Mb region of the left arm of chromosome 16. FAIRE signal from early passage and senescent LF1 cells is shown in tracks 4 and 5; other tracks present selected data from public databases. Note that FAIRE enrichment in senescent cells becomes more uniform and increases in heterochromatic late-replicating regions. H3K4me3 and H3K9me3 data for normal human lung fibroblasts (tracks 1, 2) were reported by (Ernst et al., 2011) and obtained from ENCODE. The early and late replicating tracks (tracks 3, 4) were generated from data reported by (Hansen et al., 2010). The DNase hypersensitivity, FAIRE, and RNA Pol II ChIP-seq data for the GM12878 lymphoblastoid and HeLa cell lines (tracks 8–13) were taken from the ENCODE Open Chromatin tracks, release 3 (Mar 2010). RefSeq genes and CpG islands (tracks 6,7) are from the UCSC genome browser. (B) Genome-wide FAIRE enrichment profile of early and late replicating regions in early passage and senescent cells. Genomic feature coverage was computed for reads mapping to unique locations. FAIRE-seq and input sample read counts were normalized to total unique mapping reads and used to calculate log2 fold changes for senescent and early passage cells. Kernel smoothing density estimation (Bowman & Azzalini, 1997) was applied to the distributions of log2 fold changes. These changes were significant using the bootstrap randomization method (below). (C) Genome-wide FAIRE enrichment of regions marked by H3K4me3 modification. Analysis was performed as in (B) using coordinates for H3K4me3 modification and represented in bar graph format. Statistical validation was performed using a bootstrap randomization of the coordinate files. Log2 (FAIRE/input) values of the original and randomized datasets were computed, and a two-tailed t-test was applied assuming unequal variances. **The results were significant in all cases (p < 0.01). (D) Genome-wide FAIRE enrichment of regions marked by H3K9me3 modification. Analysis was performed as described in (C).
Fig. 3
Fig. 3
Analysis of repetitive elements in early passage and senescent cells. (A) Relative abundance of Alu, L1, SVA and satellite elements in FAIRE-seq datasets. The representation of RepeatMasker annotated repetitive elements was computed for FAIRE-seq datasets using the software pipeline of (Day et al., 2010). Read counts were normalized to the total number of mapping reads, and fold changes were calculated as the Log2 (FAIRE/input). The graph shows each repetitive element subfamily as a point by plotting early passage changes along the X axis versus senescent changes along the Y axis. The relative enrichments of the four quadrants are (clockwise from top left): 1) depleted in early FAIRE and enriched in senescent FAIRE (X<0, Y>0), top left; 2) enriched in both early and senescent FAIRE (X>0, Y>0), top right; 3) enriched in early FAIRE and depleted in senescent FAIRE (X>0, Y<0), bottom right; and 4) depleted in both early and senescent FAIRE (X<0, Y<0), bottom left. The great majority of elements are found in quadrants 3 and 4. Quadrant 3 contains mostly ancient L1 elements, and quadrant 4 contains the majority of Alu, SVA and satellite elements, and the evolutionarily recent L1 elements. The diagonal in quadrant 4 demarcates the regions of relative enrichment in early versus senescent FAIRE, the yellow portion being the region where derepression occurs in senescent cells, and where the majority of potentially active Alu, SVA and L1 elements as well as the satellite elements are located. Alternative representations as bar graphs are shown in Fig. S6-S7. (B) Alu and L1 sequences are enriched in FAIRE DNA extracted from senescent cells. DNA preparations (FAIRE and input) were spotted onto nylon membranes and probed with 32P-labeled Alu and L1 probes. FAIRE signals were subtracted for background and normalized to the amount of DNA spotted. Data are shown normalized to input, and expressed as fold-change relative to early passage cells. The means and standard deviations of 3 independent experiments are shown (p < 0.01). (C) Expression of Alu and L1 RNAs is increased in senescent cells. Total RNA was prepared from early passage and senescent cells, exhaustively depleted of DNA, reverse transcribed, and quantified by qPCR. Data are shown normalized to GAPDH, and expressed as fold-change relative to early passage cells. The means and standard deviations of 3 independent experiments are shown (p < 0.01). (D) Copy number of L1 elements is increased in genomic DNA of senescent cells. Total DNA was prepared from early passage, senescent, and late senescent (12–14 weeks) cells, and L1 copy number was quantified using multiplex qPCR as described (Coufal et al., 2009). Data shown were normalized to 5S rDNA (normalization to L1 5′ UTR produced the same results), and are expressed as % increase relative to early passage cells (shown as 0%). The means and standard deviations of 3 independent experiments are shown. The 3–4% increase in senescent cells was reproducible in repeated experiments but not statistically significant; the 11% increase in late senescent cells was significant at p < 0.01. Based on in silico PCR simulations with the L1 ORF2 primers used, an increase of 11% corresponds to approximately 150 new insertions.
Fig. 4
Fig. 4
EM and centromere FISH analysis of senescent cell nuclei. (A) The peripheral heterochromatic compartment decreases in senescent cells. Representative electron micrographs (left panels) show the distribution of heterochromatin (dark staining) on the inside (right side) of the nuclear membrane (indicated with orange arrow heads). Scale bar = 200 nm. The graph on the right shows the quantification of the heterochromatic staining within a 200 nm region adjacent to the nuclear membrane (p < 0.01). (B) Centromeric regions become disorganized and enlarged in senescent cells. FISH was performed with a probe to hSATII. Each panel is a composite of several representative nuclei from images of early passage (left) and senescent (right) cells. Scale bar = 10 μm.

References

    1. Baker DJ, Wijshake T, Tchkonia T, LeBrasseur NK, Childs BG, van de Sluis B, Kirkland JL, van Deursen JM. Clearance of p16Ink4a-positive senescent cells delays ageing-associated disorders. Nature. 2011;479:232–236. - PMC - PubMed
    1. Batzer MA, Deininger PL. Alu repeats and human genomic diversity. Nat Rev Genet. 2002;3:370–379. - PubMed
    1. Belancio VP, Roy-Engel AM, Deininger PL. All y’all need to know ‘bout retroelements in cancer. Semin Cancer Biol. 2010;20:200–210. - PMC - PubMed
    1. Berman BP, Weisenberger DJ, Aman JF, Hinoue T, Ramjan Z, Liu Y, Noushmehr H, Lange CP, van Dijk CM, Tollenaar RA, Van Den Berg D, Laird PW. Regions of focal DNA hypermethylation and long-range hypomethylation in colorectal cancer coincide with nuclear lamina-associated domains. Nat Genet. 2012;44:40–46. - PMC - PubMed
    1. Bowman AW, Azzalini A. Applied smoothing techniques for data analysis. New York: Oxford University Press; 1997.

Publication types