

Vector production in an academic environment: a tool to assess production costs
- PMID: 23360377
- PMCID: PMC4015083
- DOI: 10.1089/hgtb.2012.213
Vector production in an academic environment: a tool to assess production costs
Abstract
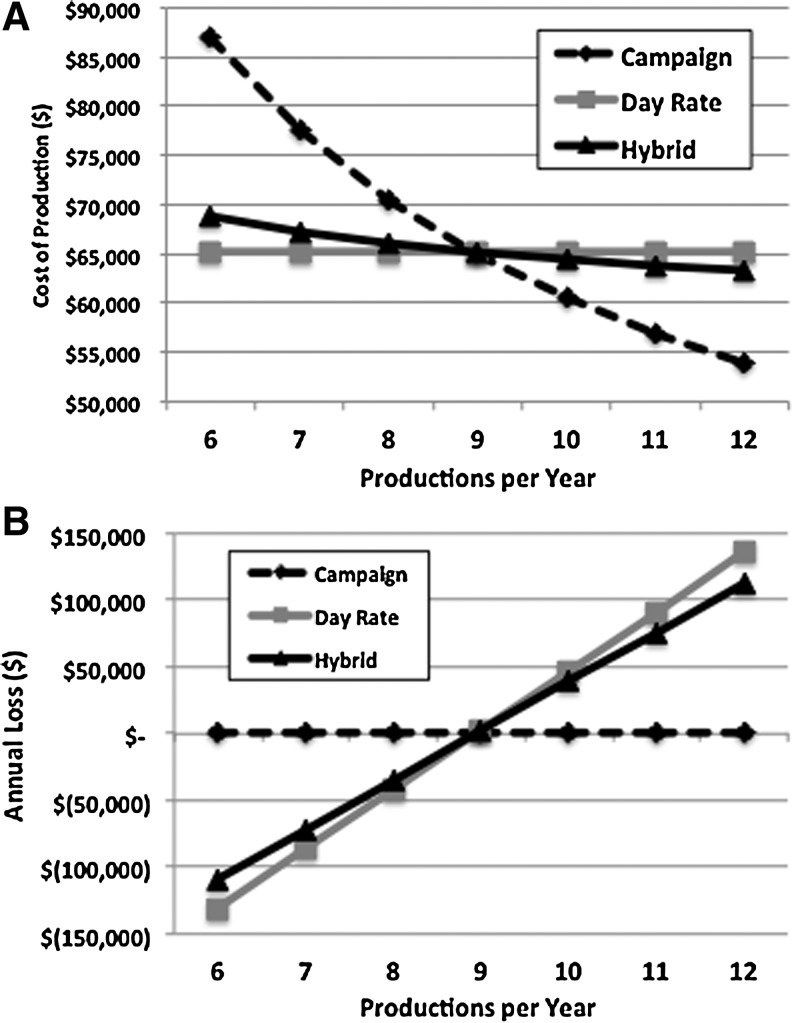
Generating gene and cell therapy products under good manufacturing practices is a complex process. When determining the cost of these products, researchers must consider the large number of supplies used for manufacturing and the personnel and facility costs to generate vector and maintain a cleanroom facility. To facilitate cost estimates, the Indiana University Vector Production Facility teamed with the Indiana University Kelley School of Business to develop a costing tool that, in turn, provides pricing. The tool is designed in Microsoft Excel and is customizable to meet the needs of other core facilities. It is available from the National Gene Vector Biorepository. The tool allows cost determinations using three different costing methods and was developed in an effort to meet the A21 circular requirements for U.S. core facilities performing work for federally funded projects. The costing tool analysis reveals that the cost of vector production does not have a linear relationship with batch size. For example, increasing the production from 9 to18 liters of a retroviral vector product increases total costs a modest 1.2-fold rather than doubling in total cost. The analysis discussed in this article will help core facilities and investigators plan a cost-effective strategy for gene and cell therapy production.
Figures


References
-
- Aiuti A. Cattaneo F. Galimberti S., et al. Gene therapy for immunodeficiency due to adenosine deaminase deficiency. New Engl. J. Med. 2009;360:447–458. - PubMed
-
- Anderson S.R. Kaplan R.S. Time-driven activity-based costing. Harvard Business Review. 2004;82:60–68. - PubMed
-
- Bainbridge J.W.B. Smith A.J. Barker S.S., et al. Effect of Gene therapy on visual function in Leber's congenital amaurosis. New Engl. J. Med. 2008;358:2231–2239. - PubMed
-
- Cartier N. Hacein-Bey Abina S. Bartholomae C.C., et al. Hematopoietic stem cell gene therapy with a lentiviral vector in X-linked adrenoleukodystrophy. Science. 2009;326:818–823. - PubMed
-
- Cooper R. Kaplan R.S. Activity-based systems: measuring the costs of resource usage. Accounting Horizon. 1992;6:1–11.
Publication types
MeSH terms
Grants and funding
LinkOut - more resources
Full Text Sources
Other Literature Sources
