. 2013 Apr;37(7):1090-102.
doi: 10.1111/ejn.12119. Epub 2013 Jan 29.

Motor cortex electrical stimulation promotes axon outgrowth to brain stem and spinal targets that control the forelimb impaired by unilateral corticospinal injury

Affiliations

Motor cortex electrical stimulation promotes axon outgrowth to brain stem and spinal targets that control the forelimb impaired by unilateral corticospinal injury

Jason B Carmel et al. Eur J Neurosci. 2013 Apr.

Abstract

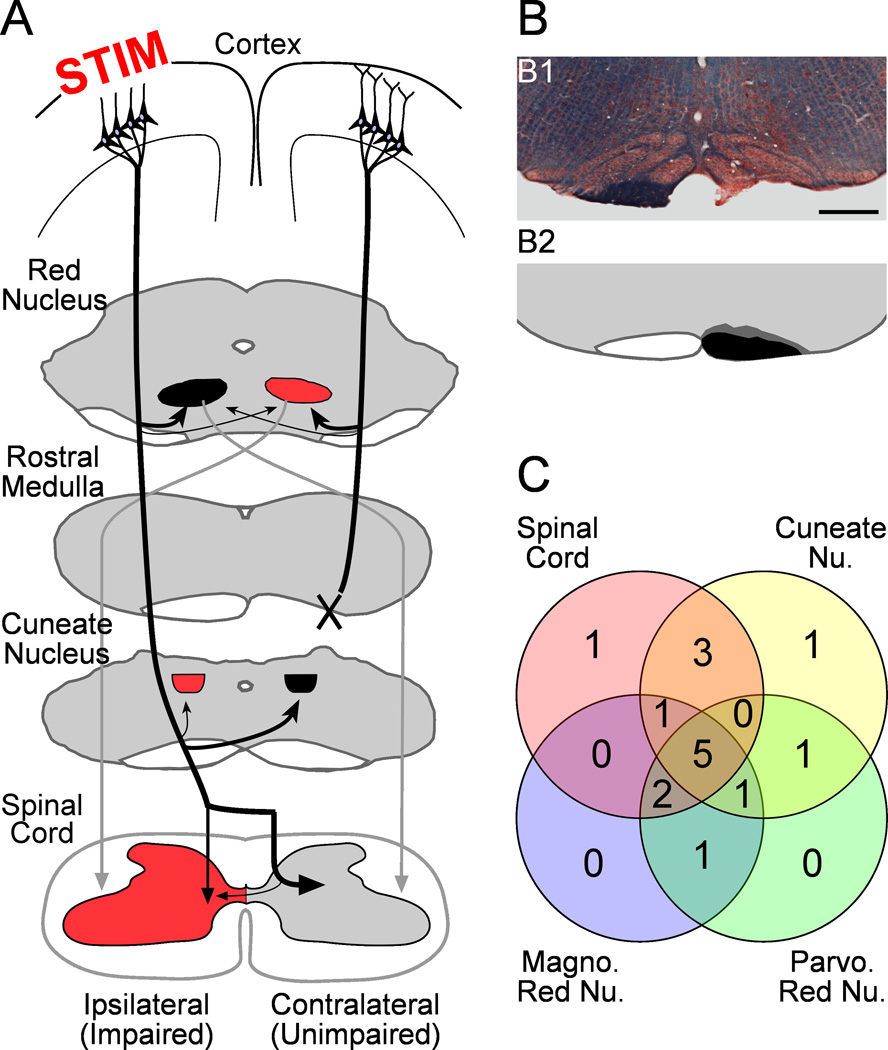
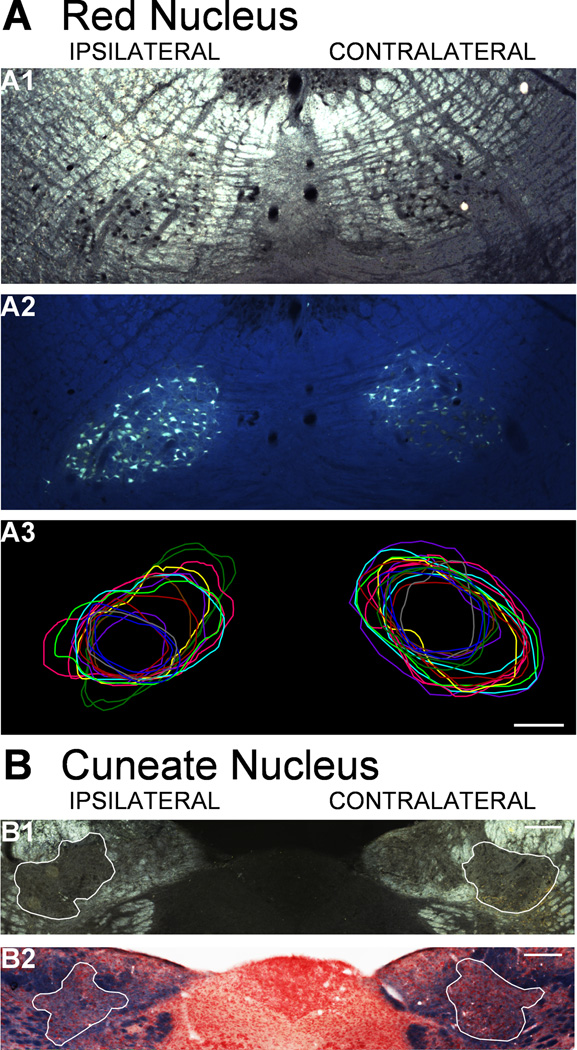
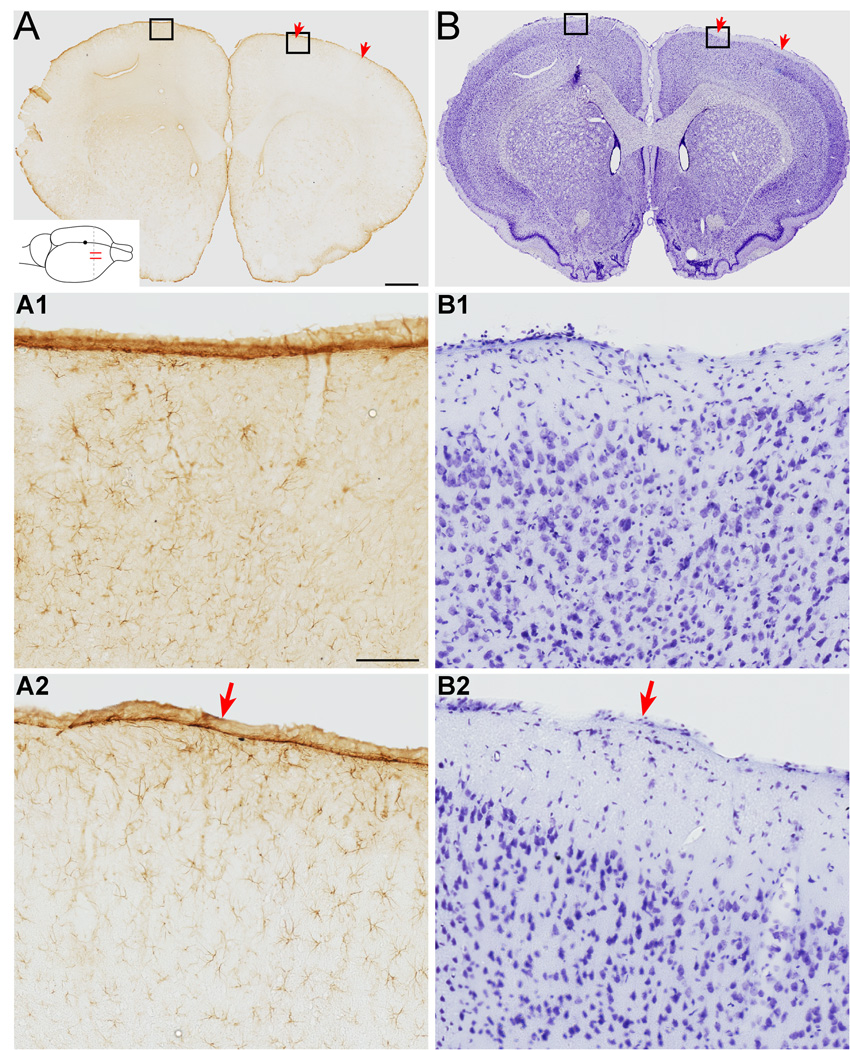
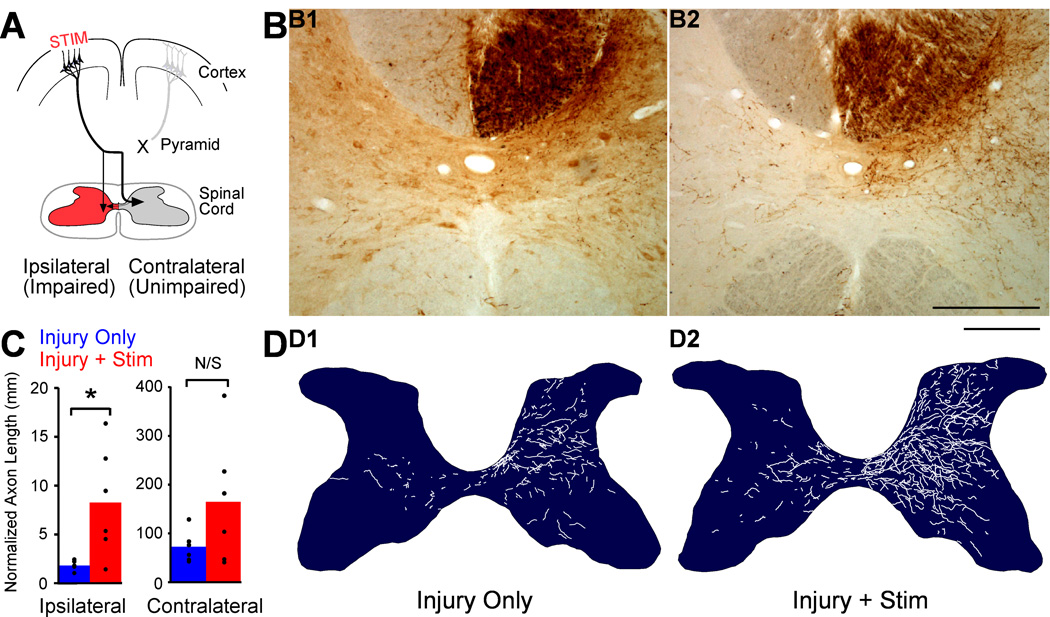
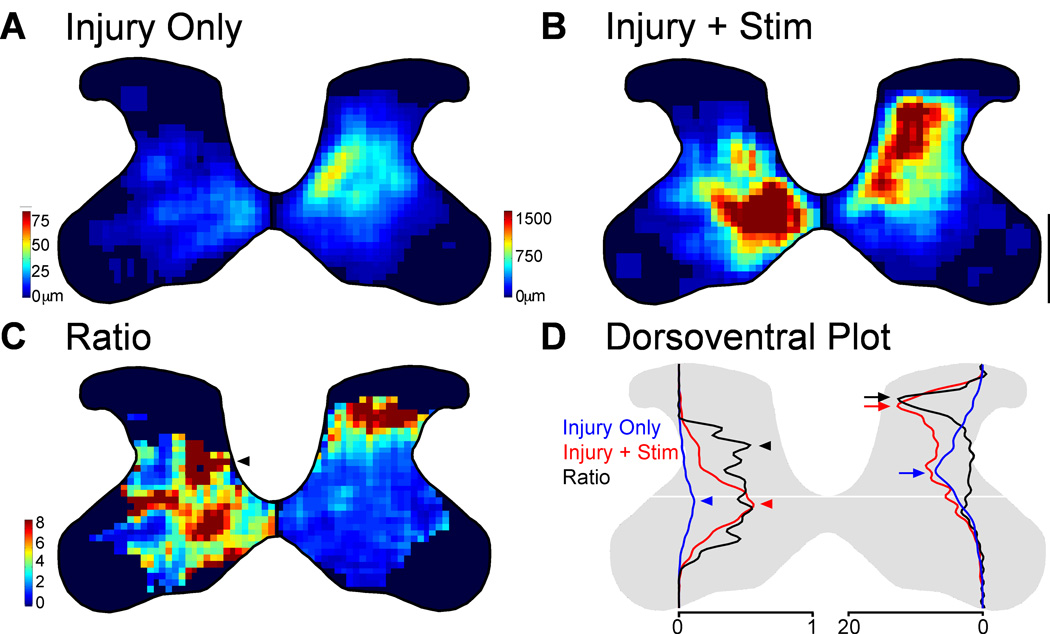
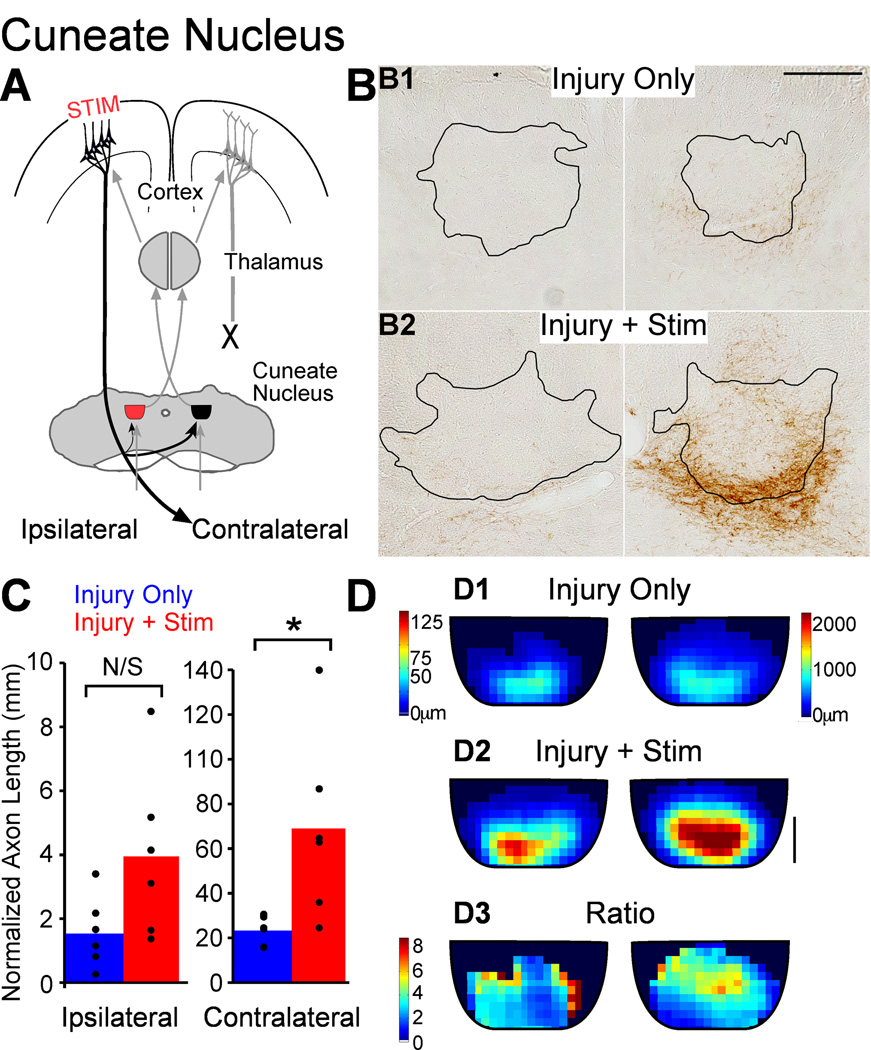
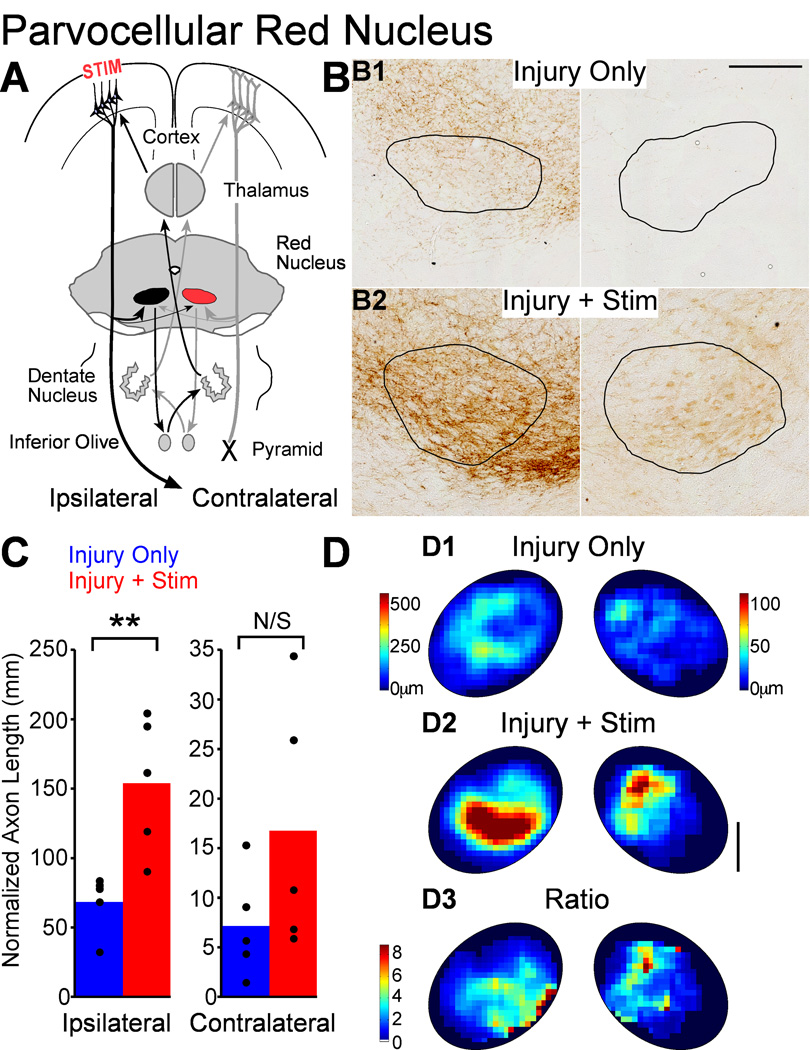
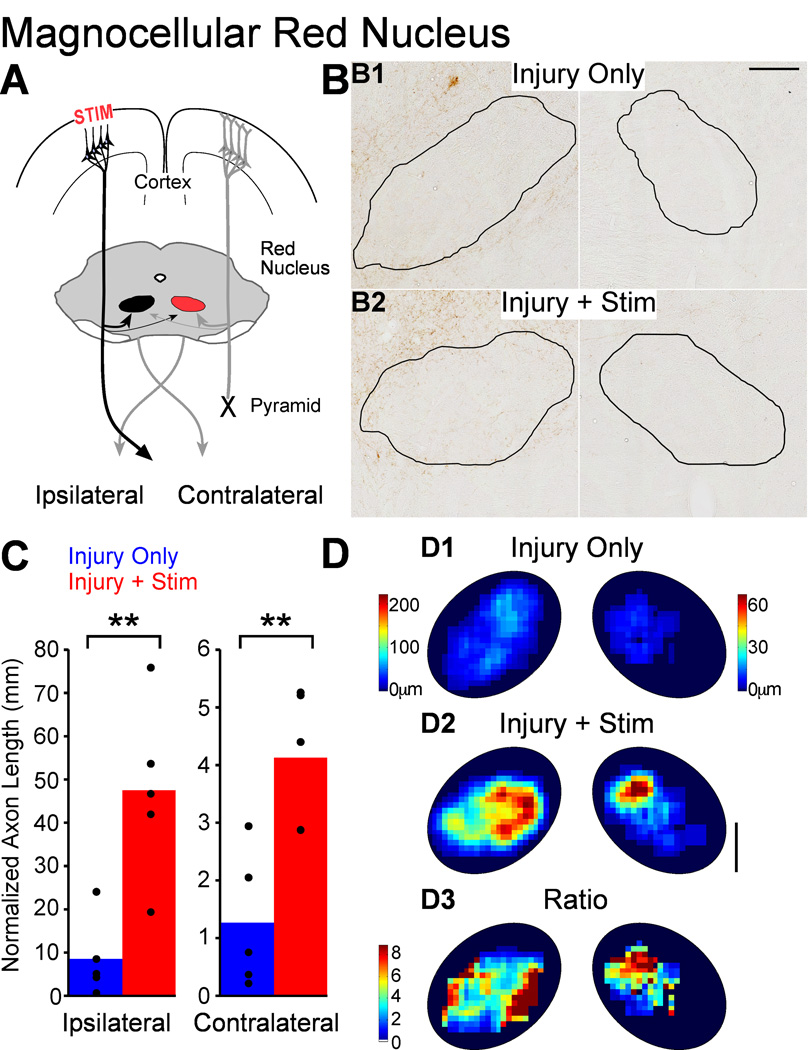
We previously showed that electrical stimulation of motor cortex (M1) after unilateral pyramidotomy in the rat increased corticospinal tract (CST) axon length, strengthened spinal connections, and restored forelimb function. Here, we tested: (i) if M1 stimulation only increases spinal axon length or if it also promotes connections to brain stem forelimb control centers, especially magnocellular red nucleus; and (ii) if stimulation-induced increase in axon length depends on whether pyramidotomy denervated the structure. After unilateral pyramidotomy, we electrically stimulated the forelimb area of intact M1, to activate the intact CST and other corticofugal pathways, for 10 days. We anterogradely labeled stimulated M1 and measured axon length using stereology. Stimulation increased axon length in both the spinal cord and magnocellular red nucleus, even though the spinal cord is denervated by pyramidotomy and the red nucleus is not. Stimulation also promoted outgrowth in the cuneate and parvocellular red nuclei. In the spinal cord, electrical stimulation caused increased axon length ipsilateral, but not contralateral, to stimulation. Thus, stimulation promoted outgrowth preferentially to the sparsely corticospinal-innervated and impaired side. Outgrowth resulted in greater axon density in the ipsilateral dorsal horn and intermediate zone, resembling the contralateral termination pattern. Importantly, as in spinal cord, increase in axon length in brain stem also was preferentially directed towards areas less densely innervated by the stimulated system. Thus, M1 electrical stimulation promotes increases in corticofugal axon length to multiple M1 targets. We propose the axon length change was driven by competition into an adaptive pattern resembling lost connections.


Conflict of interest statement

The authors have no conflicts of interest.

Figures

Figure 1
Figure 1
A. Experimental schema. The CST from one hemisphere is cut (X; pyramidotomy) at the rostral medulla. This removes axon projections from M1 on the side of pyramidotomy to the spinal cord and cuneate nucleus but not the red nucleus. In the other hemisphere, an epidural electrode over forelimb M1 is used to deliver chronic electrical stimulation (STIM). The stimulated M1 is anterogradely labeled, and the corticofugal terminations measured in the spinal cord, cuneate nucleus, and red nucleus. Structures in red may be targeted to restore function of the impaired forelimb. B. Pyramidotomy completely severs the CST without extension into adjacent structures. B1. Kluver-Barera stain of the pyramidotomy site; the intact pyramid is dark blue. B2. The right pyramid shows a semi-schematic drawing of the smallest (black) and largest (dark gray) lesions of the pyramid. C. The overlap of rats used for analysis of each M1 target.
Figure 2
Figure 2
Methods for defining the red nucleus and cuneate nucleus. A. Red nucleus. A1. Darkfield image of the red nuclei. The nuclear region was identified by the dark cell bodies. A2. Fluorescence image of the same section as A1. Fluorogold injected into C6 spinal gray matter labeled the magnocellular red nucleus. A3. Contours drawn under darkfield imaging to outline the parvocellular red nucleus in each animal (separate colors) were highly reproducible. Scale bar, 250µm. B. Cuneate nucleus. B1. Darkfield imaging of the caudal medulla is used to verify nucleus boundaries. B2. Kluver-Barrera staining of an adjacent section is used to validate the location for the nucleus (red) from the surrounding white matter (blue). Scale bars, 100µm.
Figure 3
Figure 3
Stereological methods of assessing axon length and regional distribution. A. BDA-labeled spinal cord cross section at C6. A1. Montage image of the gray matter. Scale bar, 500µm. A2. BDA-labeled axons at 400x. Scale bar, 10µm. A3. Axons intersect (red arrows) a virtual sphere (“space ball”) that appears as a white circle of varying diameters. Scale bar, 10µm. B. A map of interactions between the “space ball” probe and BDA-labeled axons. The sparse ipsilateral side (left) was sampled more intensely than the dense contralateral side (right). C. Using MATLAB, heat maps of axon length within local regions (40µm by 40µm) are created. Note the difference in scaling of the two sides.
Figure 4
Figure 4
Electrical stimulation does not produce gliosis or alter cellular architecture in M1. A. GFAP stained sections of cortex under the stimulating electrode section at approximately bregma +1.7mm from a rat with chronic epidural stimulation. The approximate position of the stimulating electrodes is marked with red arrows. Inset shows a schematic of stimulating electrodes (red) and plane of section for photomicrographs (interrupted line). The black dot represents bregma. There is no increase in overall GFAP signal in stimulated M1 compared with the non-stimulated side. Scale bar, 1mm. A1, A2 show high power images of M1. The glial cell architecture is similar for each. Scale bar, 100µm. B. Nissl stain of an adjacent section. The cellular architecture is similar for each motor cortex. B1, B2. Higher magnification images of each M1 showing normal cellular morphology. Scale bars in A apply to B.
Figure 5
Figure 5
M1 stimulation causes robust outgrowth to the spinal cord and targets the impaired side. A. Schema. Outgrowth to the impaired side of the spinal cord (red) is most likely to help restore function. B. BDA-labeled axons in C6 spinal cord cross section centered on the central canal. B1. A section from a representative injury only rat shows BDA-label is dense contralateral (right) and sparse ipsilateral (left). B2. A section from a representative injury and stimulation rat shows much greater axon label than in the rat with injury only. Scale bar, 250µm. C. Quantification of total axon length within each side of the spinal cord gray matter. D. Representative individual spinal cross-sections showing hand-traced BDA-labeled axons. D1 is traced from the section in B1, and D2 is traced from the section in B2.Scale bar, 500µm.
Figure 6
Figure 6
Partial restoration of normal axon distribution on the impaired side of the spinal cord. A. Spatially corrected local axon length map for rats with injury only. B. Local axon length map for rats with injury and stimulation. Intensity scales in A also apply to B. Note, the axon length scales are different on the two sides to show the full range on each side. C. Stimulation-induced outgrowth is shown as the pixel-by-pixel ratio of injury and stimulation rats to injury only rats expressed as fold-change. The arrowhead indicates a hot spot of stimulation-induced outgrowth on the ipsilateral side in the deep dorsal horn. D. Dorsoventral distribution of axon density for rats with injury only (blue) and rats with injury and stimulation (red). The scales (bottom) on the two sides of the spinal cord are relative axon length apply only to the red and blue lines. Black lines represent the ratio of injury and stimulation rats to injury only rats and are scaled equivalently on the two sides. Arrows and arrowheads indicate peaks. Scale bar, 500µm. * P<0.05, corrected for multiple comparisons.
Figure 7
Figure 7
M1 stimulation causes robust outgrowth to the cuneate nucleus. A. Schema. Outgrowth to the ipsilateral cuneate nucleus (red) could help modify sensory information projecting to M1 on the side of injury. B. Micrographs of BDA-labeled axons in cuneate nucleus (outlined) of representative rats. Scale bar, 250µm. C. Quantification of total axon length. D. Local axon length maps. Intensity scales in D1 also apply to D2. Note the axon length scales are different on the two sides to show the full range on each side. D3. Stimulation-induced outgrowth is shown as the pixel-by-pixel ratio of injury and stimulation rats to injury only rats expressed as fold-change. Scale bar, 100µm. * P<0.05, corrected for multiple comparisons.
Figure 8
Figure 8
M1 stimulation causes robust outgrowth to the parvocellular red nucleus. A. Schema. M1 projections to the contralateral nucleus (colored red) could participate in control of the impaired forelimb through a double crossed connection. B. Micrographs of BDA-labeled axons in parvocellular red nucleus (outlined) of representative rats. Scale bar, 250µm. C. Quantification of total axon length. D. Local axon length maps. Intensity scales in D1 also apply to D2. Note the axon length scales are different on the two sides to show the full range on each side. D3. Stimulation-induced outgrowth is shown as the pixel-by-pixel ratio of injury and stimulation rats to injury only rats expressed as fold-change. Scale bar 250µm. * P<0.05, corrected for multiple comparisons.
Figure 9
Figure 9
M1 stimulation causes robust outgrowth to the magnocellular red nucleus. A. Schema. Outgrowth to the contralateral nucleus (colored red) could improve motor control on the impaired side through the re-crossed rubrospinal tract. B. Micrographs of BDA-labeled axons in magnocellular red nucleus (outlined) of representative rats. C. Quantification of total axon length within each red nucleus. Scale bar, 250µm. D. Local axon length maps. Intensity scales in D1 also apply to D2. Note the axon length scales are different on the two sides to show the full range on each side. D3. Stimulation-induced outgrowth is shown as the pixel-by-pixel ratio of injury and stimulation rats to injury only rats expressed as fold-change. Scale bar 250µm. * P<0.05, corrected for multiple comparisons.

Similar articles

Cited by

References

    1. Alilain WJ, Horn KP, Hu H, Dick TE, Silver J. Functional regeneration of respiratory pathways after spinal cord injury. Nature. 2011;475:196–200. - PMC - PubMed
    1. Andersen P, Eccles JC, Schmidt RF. Presynaptic inhibition in the cuneate nucleus. Nature. 1962;194:741–743. - PubMed
    1. Bareyre FM, Kerschensteiner M, Raineteau O, Mettenleiter TC, Weinmann O, Schwab ME. The injured spinal cord spontaneously forms a new intraspinal circuit in adult rats. Nat Neurosci. 2004;7:269–277. - PubMed
    1. Brosamle C, Schwab ME. Cells of origin, course, and termination patterns of the ventral, uncrossed component of the mature rat corticospinal tract. J Comp Neurol. 1997;386:293–303. - PubMed
    1. Brown LT. Rubrospinal projections in the rat. J Comp Neurol. 1974;154:169–187. - PubMed

Publication types

LinkOut - more resources