. 2013 Jan 28;14(1):R7.
doi: 10.1186/gb-2013-14-1-r7.

Inferring the kinetics of stochastic gene expression from single-cell RNA-sequencing data

Inferring the kinetics of stochastic gene expression from single-cell RNA-sequencing data

Jong Kyoung Kim et al. Genome Biol. .

Abstract

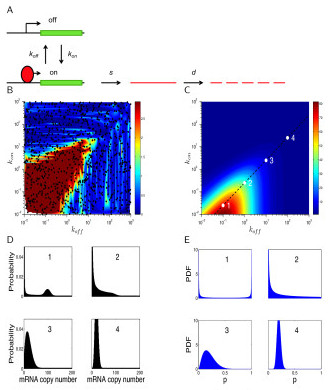
Background: Genetically identical populations of cells grown in the same environmental condition show substantial variability in gene expression profiles. Although single-cell RNA-seq provides an opportunity to explore this phenomenon, statistical methods need to be developed to interpret the variability of gene expression counts.

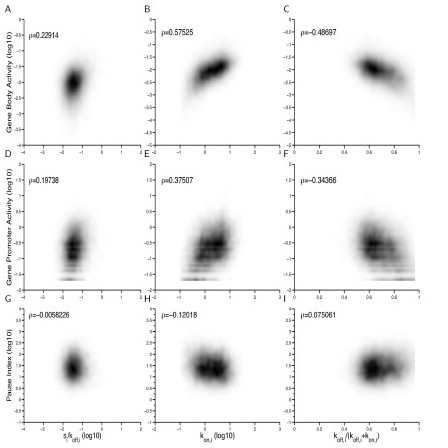
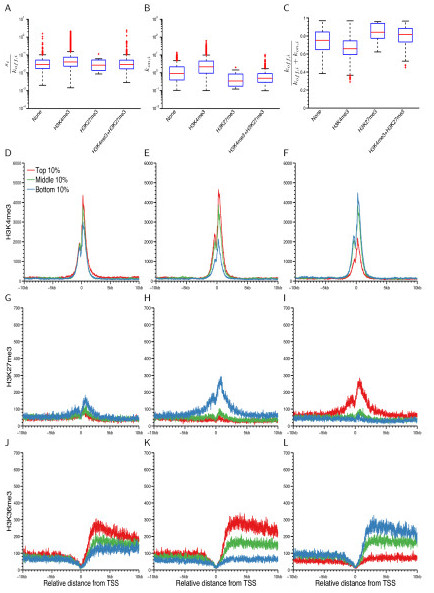
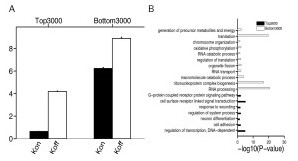
Results: We develop a statistical framework for studying the kinetics of stochastic gene expression from single-cell RNA-seq data. By applying our model to a single-cell RNA-seq dataset generated by profiling mouse embryonic stem cells, we find that the inferred kinetic parameters are consistent with RNA polymerase II binding and chromatin modifications. Our results suggest that histone modifications affect transcriptional bursting by modulating both burst size and frequency. Furthermore, we show that our model can be used to identify genes with slow promoter kinetics, which are important for probabilistic differentiation of embryonic stem cells.

Conclusions: We conclude that the proposed statistical model provides a flexible and efficient way to investigate the kinetics of transcription.


Figures

Figure 1
Figure 1
Poisson-beta model. (A) Schematic of a two-state kinetic model for stochastic gene expression. (B) Heat map of the maximum P values of two goodness-of-fit tests for Poisson and negative binomial distributions. One thousand combinations of kon and koff were uniformly sampled from the log space by fixing s to 100. For each combination of the sampled parameters, 1,000 independent samples were generated from the Poisson-beta distribution to evaluate the fit of the data to the Poisson and negative binomial distributions using a bootstrap-based goodness-of-fit test. The colors represent minus log10-transformed P values and the heat map is interpolated from the scattered data by using a Delaunay triangulation method. (C) Heat map of the Fano factor as a function of kon and koff with a fixed rate of transcription (s = 100). Along the black dashed line fixing the average number of mRNA molecules to 20, the four combinations of kon and koff give the varied level of the Fano factor and show different patterns of the variability of the number of mRNA molecules between cells. At point 1 with the highest Fano factor, the transitions between the two promoter states are slow, and the standardized expression level of a gene exhibits a U-shaped distribution, resulting in a bimodal distribution. At point 2, the transition to the inactive state is faster than the transition to the active state, and therefore the mRNA distribution has a long right tail resulting from occasional transcriptional bursts. As kon and koff increase at points 3 and 4, transitions between promoter states become fast, resulting in a Poisson-like distribution of the number of mRNA molecules with the Fano factor approaching 1. Note that this plot is similar to a recent figure generated by [25]. (D) Representative Poisson-beta distributions from four points in (C), which were computed with the auxiliary variable approach. (E) The corresponding beta distributions of p.
Figure 2
Figure 2
Correlation of transcriptional kinetics with RNA polymerase II binding in mouse ES cells. In the left panel, burst size (or transcriptional efficiency) is plotted on the x-axis. In the middle panel, burst frequency is plotted on the x-axis. In the right panel, the average fraction of time that a gene spends in the inactive state is plotted on the x-axis. In all the panels, the following are plotted on the y-axis: the gene body activity (A)-(C), the gene promoter activity (D)-(F), and the pause index (G)-(I). Each point represents one identifiable gene with a normalized read count greater than 50 in at least one cell. ρ is the Spearman correlation coefficient.
Figure 3
Figure 3
Correlation of transcriptional kinetics with histone modifications in mouse ES cells. (A)-(C) Box plots that compare burst size (A), burst frequency (B), and the average fraction of time that a gene spends in the inactive state (C) in the four groups. Given the annotated chromatin state of the two histone modifications by [33], we classified all expressed genes with a normalized read count greater than 50 in at least one cell that have chromatin state annotations into four groups: H3K4me3 only (n = 6,291), H3K27me3 only (n = 10), H3K4me3 + H3K27me3 (n = 630) and none (n = 492). The H3K4me3 group is significantly different from the others except the H3K27me3 group: P < 10-16 for si/kon,i, P < 10-16 for kon,i, P < 10-16 for koff,i/(koff,i + kon,i), by the Mann-Whitney U-test. Due to the small number of samples of the H3K27me3 group, the H3K4me3 group is less significantly different from the H3K27me3 group: P = 0.0486 for si/kon,i, P = 2.73 × 10⁻⁵ for kon,i, P = 8.12 × 10⁻⁵ for koff,i/(koff,i + kon,i). In each box plot, the central red line indicates the median value, the top and bottom edges of the box are the 75th (q3) and 25th (q1) percentiles, and the ends of the whiskers denote q3 + 1.5(q3 - q1) and q1 - 1.5(q3 q1). (D)-(L) The profiles of H3K4me3, H3K27me3, and H3K36me3 ChIP-seq reads mapped near TSSs (Transcription Start Sites) are shown for genes with values of the three kinetic quantities in the top 10% (red), middle 10% (green), and bottom 10% (blue) of the relevant distribution. The y-axis is the total number of reads mapped to each position.
Figure 4
Figure 4
Functional enrichment of noisy genes showing distinctive bursting patterns of gene expression in mouse ES cells. (A) The mean of kon,i and koff,i (± S.E.) for the top and bottom 3,000 genes sorted by koff,i/ kon,i. (S.E. = standard error). (B) The Benjamini corrected P values of the 18 GO terms enriched in the top or bottom 3,000 genes. GO, gene oncology.

Similar articles

Cited by

References

    1. Mortazavi A, Williams BA, McCue K, Schaeffer L, Wold B. Mapping and quantifying mammalian transcriptomes by RNA-Seq. Nature Methods. 2008;5:621–628. doi: 10.1038/nmeth.1226. - DOI - PubMed
    1. Marioni JC, Mason CE, Mane SM, Stephens M, Gilad Y. RNA-seq: an assessment of technical reproducibility and comparison with gene expression arrays. Genome Research. 2008;18:1509–1517. doi: 10.1101/gr.079558.108. - DOI - PMC - PubMed
    1. Wang Z, Gerstein M, Snyder M. RNA-Seq: a revolutionary tool for transcriptomics. Nature Reviews Genetics. 2009;10:57–63. doi: 10.1038/nrg2484. - DOI - PMC - PubMed
    1. Wang ET, Sandberg R, Luo S, Khrebtukova I, Zhang L, Mayr C, Kingsmore SF, Schroth GP, Burge CB. Alternative isoform regulation in human tissue transcriptomes. Nature. 2008;456:470–476. doi: 10.1038/nature07509. - DOI - PMC - PubMed
    1. Degner JF, Marioni JC, Pai AA, Pickrell JK, Nkadori E, Gilad Y, Pritchard JK. Effect of read-mapping biases on detecting allele-specific expression from RNA-sequencing data. Bioinformatics. 2009;25:3207–3212. doi: 10.1093/bioinformatics/btp579. - DOI - PMC - PubMed