

Comparative Study
doi: 10.1186/gb-2013-14-1-r8.
CGAL: computing genome assembly likelihoods
- PMID: 23360652
- PMCID: PMC3663106
- DOI: 10.1186/gb-2013-14-1-r8
Item in Clipboard
Comparative Study
CGAL: computing genome assembly likelihoods
Genome Biol.
.
Abstract
Assembly algorithms have been extensively benchmarked using simulated data so that results can be compared to ground truth. However, in de novo assembly, only crude metrics such as contig number and size are typically used to evaluate assembly quality. We present CGAL, a novel likelihood-based approach to assembly assessment in the absence of a ground truth. We show that likelihood is more accurate than other metrics currently used for evaluating assemblies, and describe its application to the optimization and comparison of assembly algorithms. Our methods are implemented in software that is freely available at http://bio.math.berkeley.edu/cgal/.
Figures
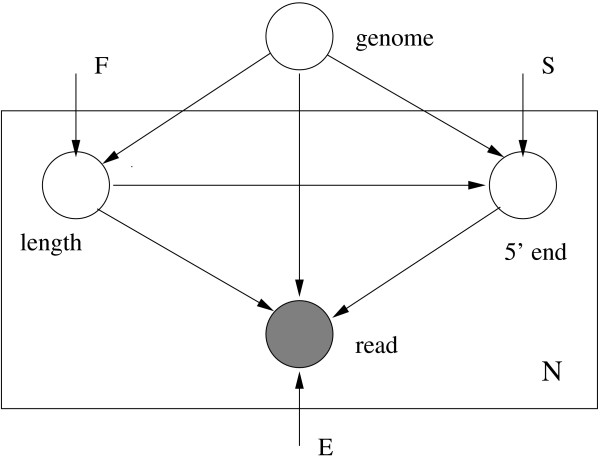
A generative graphical model for sequencing. N paired-end reads are generated independently from a genome. Here, F denotes the distribution of fragment lengths, S is the distribution of start sites of reads and E stands for error parameters.
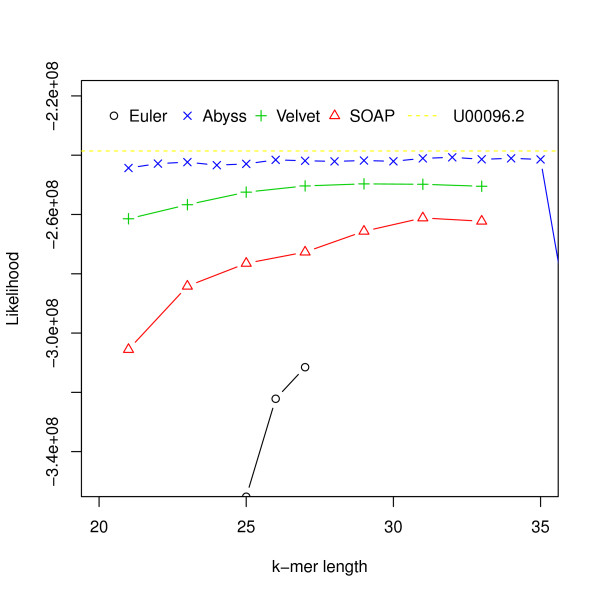
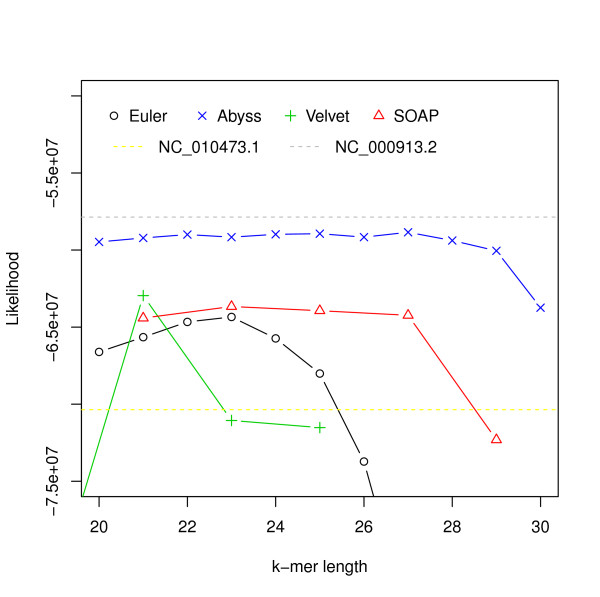
Hash length vs log likelihood for E. coli. Log likelihoods of assemblies of E. coli reads are shown on the y-axis. Assemblies are generated using different assemblers for varying k-mer length, which is shown on the x-axis. The dotted line corresponds to the log likelihood of the reference.
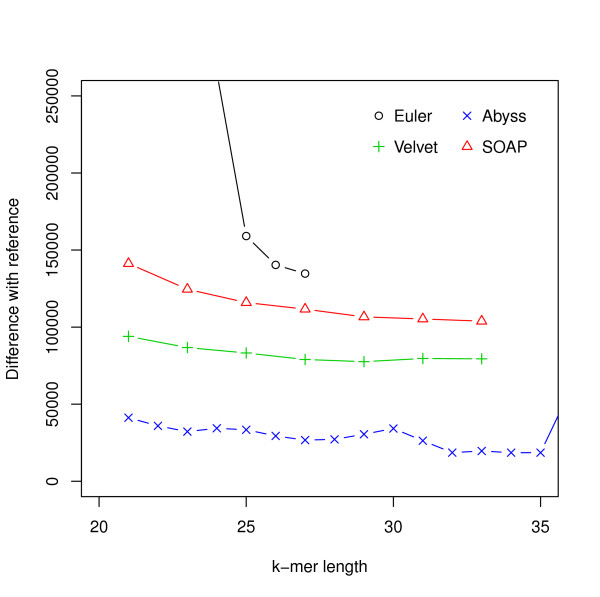
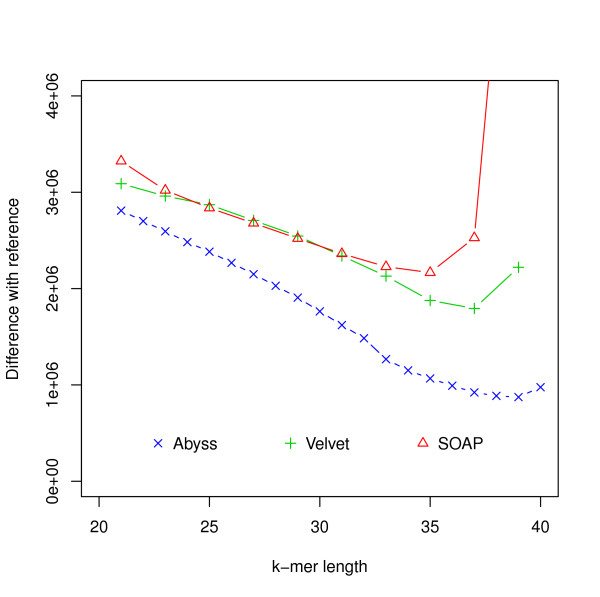
Hash length vs difference from reference for E. coli. The differences between assemblies and the reference are shown on the y-axis where the difference refers to the numbers of bases in the reference not covered by the assembly or differ between the reference and the assembly.
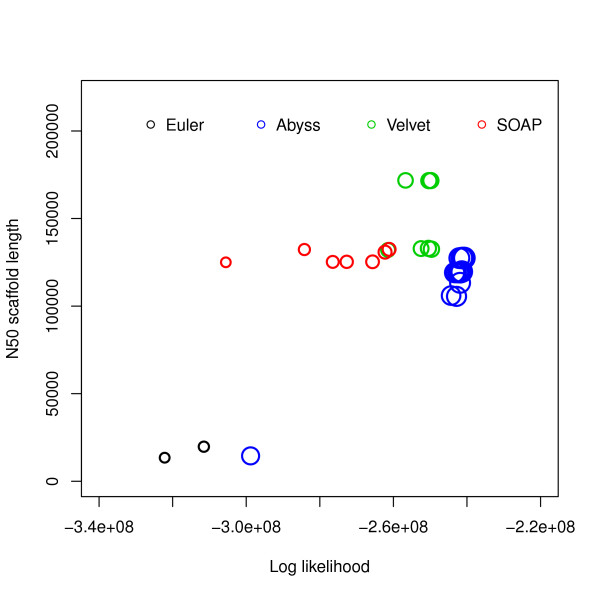
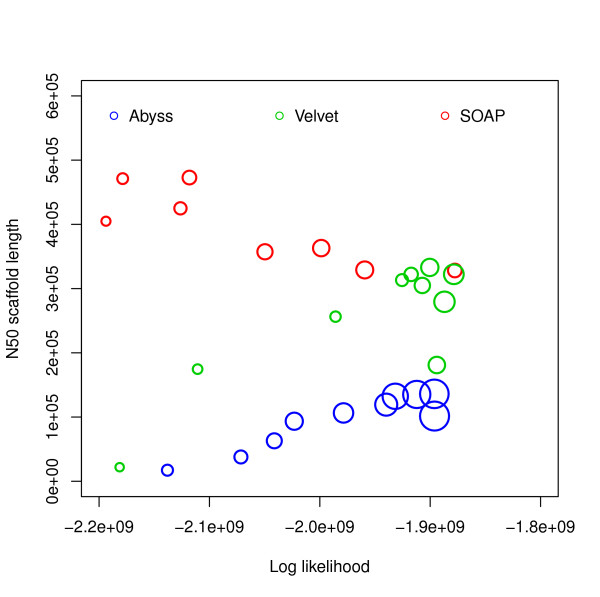
Log likelihood vs N50 scaffold length for E. coli. Log likelihoods are shown on the x-axis and N50 scaffold lengths are shown on the y-axis. Each circle corresponds to an assembly generated using an assembler for some hash length and the sizes of the circles correspond to similarity with reference. The R2 values are: (i) log likelihood vs similarity: 0.9372048, (ii) log likelihood vs N50 scaffold length: 0.44011, (iii) N50 scaffold length vs similarity: 0.3216882.
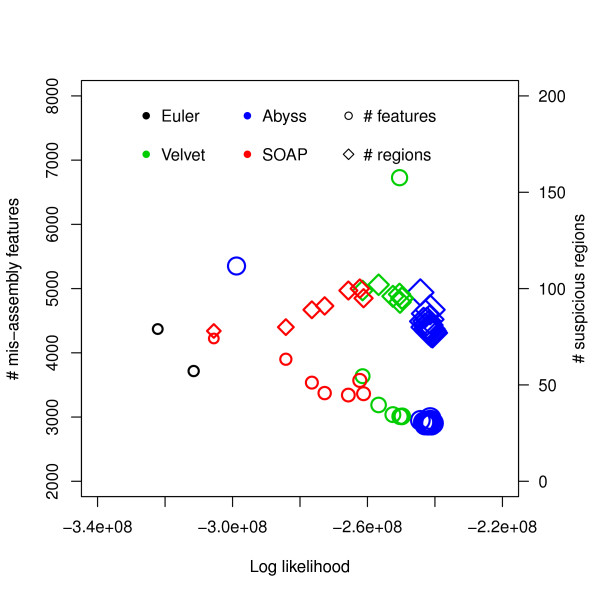
Log likelihood vs numbers of mis-assembly features and suspicious regions for E. coli. Log likelihoods are shown on the x-axis and numbers of mis-assembly features and suspicious regions reported by amosvalidate are shown on the y-axis. Each symbol corresponds to an assembly generated using an assembler for some hash length and the sizes of the symbols correspond to similarity with reference. The R2 values are: (i) log likelihood vs number of mis-assembly features: 0.8922, (ii) log likelihood vs number of suspicious regions: 0.9039, (iii) similarity vs number of mis-assembly features: 0.8211, (iv) similarity vs number of suspicious regions: 0.7723.
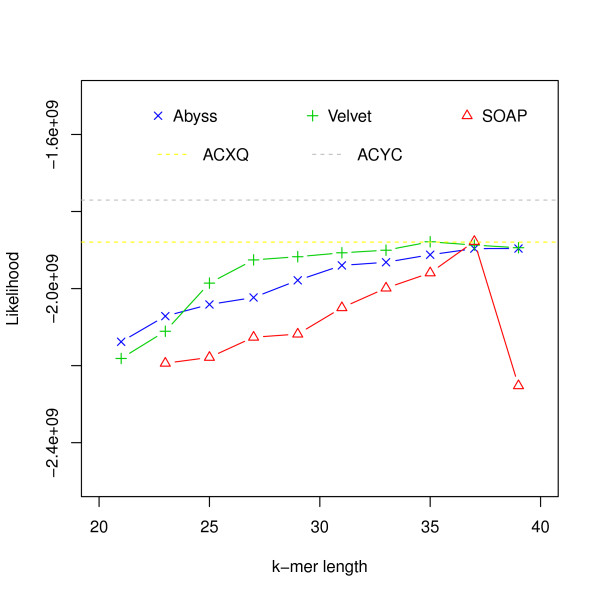
Hash length vs log likelihood for E. coli data from CLC bio. Log likelihoods of assemblies of E. coli reads from CLC bio are shown on the y-axis. Assemblies are generated using different assemblers for varying k-mer length, which is shown on the x-axis. The yellow dotted line corresponds to the log likelihood of the reference provided and the gray dotted line corresponds to the log likelihood of the strain we believe the reads were generated from.
Hash length vs log likelihood for G. clavigera. Log likelihoods of assemblies of G. clavigera reads are shown on the y-axis. Assemblies are generated using different assemblers for varying k-mer length, which is shown on the x-axis. The dotted lines correspond to the log likelihoods of the assemblies generated using Sanger, 454 and Illumina data.
Hash length vs difference from reference for G. clavigera. Differences between assemblies and the reference are shown on the y-axis where difference refers to the numbers of bases in the reference not covered by the assembly or differ between the reference and the assembly.
Log likelihood vs N50 scaffold length for G. clavigera. Log likelihoods are shown on the x-axis and N50 scaffold lengths are shown on the y-axis. Each circle corresponds to an assembly generated using an assembler for some hash length and the sizes of the circles correspond to similarity with reference. The R2 values are: (i) log likelihood vs similarity: 0.4545793, (ii) log likelihood vs N50 scaffold length: 0.002397233, (iii) N50 scaffold length vs similarity: 0.006084032.
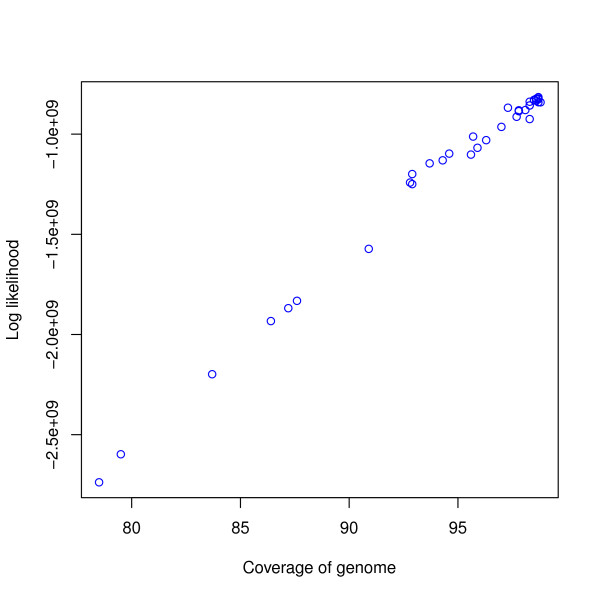
Coverage vs log likelihood for Assemblathon 1 entries. Coverage is shown on the x-axis and log likelihood is shown on the y-axis. Each circle corresponds to an assembly. The R2 value is 0.989972.
References
-
- Medvedev P, Georgiou K, Myers G, Brudno M. In: Algorithms in Bioinformatics, Volume 4645 of Lecture Notes in Computer Science. Giancarlo R, Hannenhalli S, editor. Berlin/Heidelberg: Springer; 2007. Computability of models for sequence assembly. pp. 289–301.http://dx.doi.org/10.1007/978-3-540-74126-8_27 - DOI
-
- Earl DA, Bradnam K, St John J, Darling A, Lin D, Faas J, Yu HOK, Vince B, Zerbino DR, Diekhans M, Nguyen N, Nuwantha P, Sung AWK, Ning Z, Haimel M, Simpson JT, Fronseca NA, Birol N, Docking TR, Ho IY, Rokhsar DS, Chikhi R, Lavenier D, Chapuis G, Naquin D, Maillet N, Schatz MC, Kelly DR, Phillippy AM, Koren S. et al.Assemblathon 1: a competitive assessment of de novo short read assembly methods. Genome Research. 2011;12:2224–2241. - PMC - PubMed
Publication types
MeSH terms
Grants and funding
LinkOut - more resources
Full Text Sources
Other Literature Sources
