. 2013 Jan 29;15(1):R22.
doi: 10.1186/ar4156.

Intra-articular delivery of adipose derived stromal cells attenuates osteoarthritis progression in an experimental rabbit model

Intra-articular delivery of adipose derived stromal cells attenuates osteoarthritis progression in an experimental rabbit model

Giovanna Desando et al. Arthritis Res Ther. .

Abstract

Introduction: Cell therapy is a rapidly growing area of research for the treatment of osteoarthritis (OA). This work is aimed to investigate the efficacy of intra-articular adipose-derived stromal cell (ASC) injection in the healing process on cartilage, synovial membrane and menisci in an experimental rabbit model.

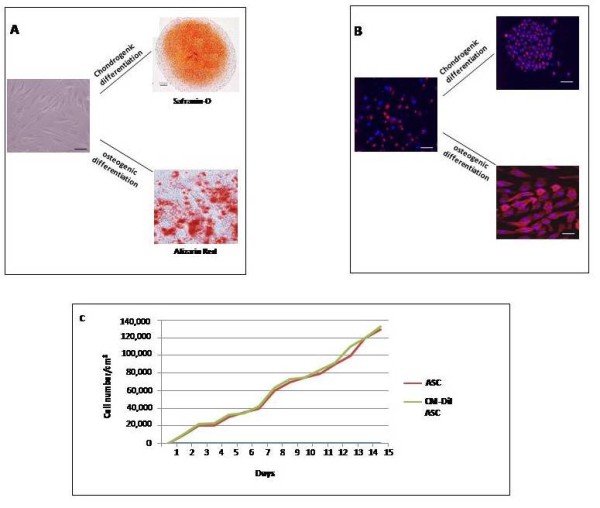
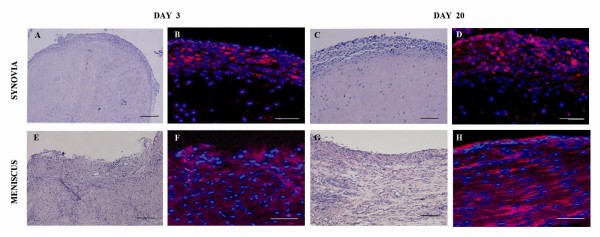
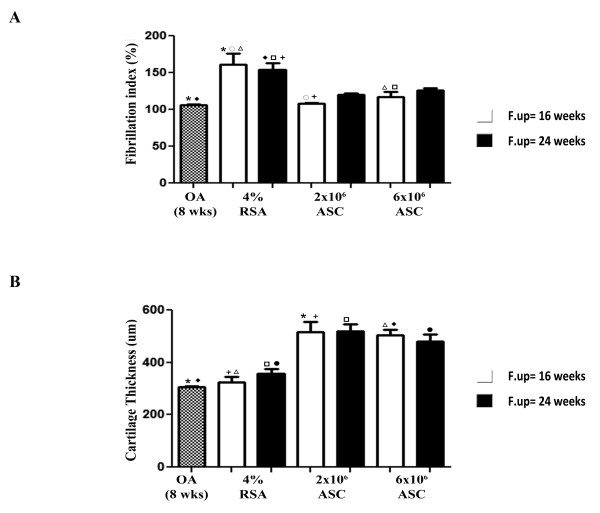
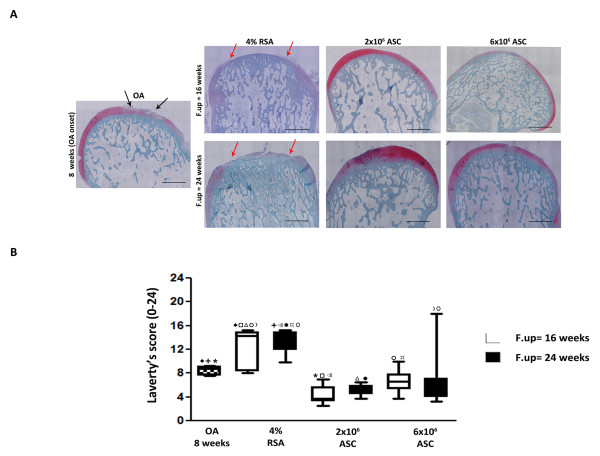
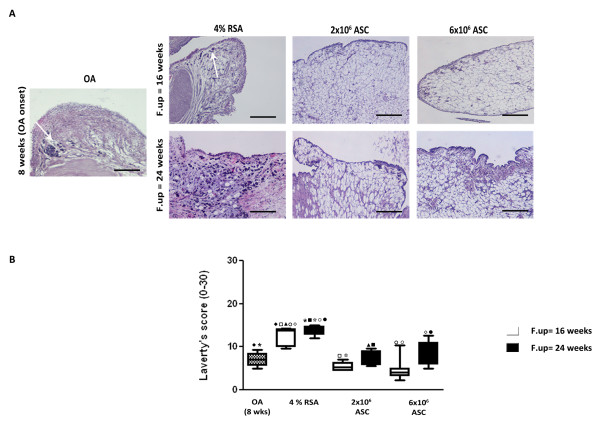
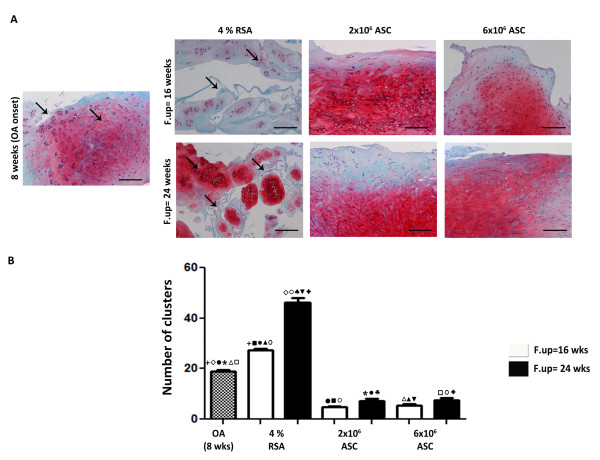
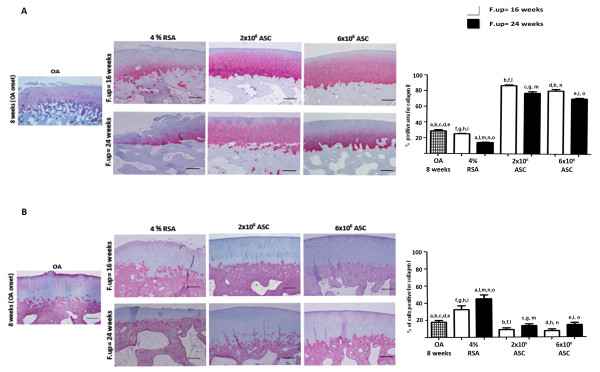
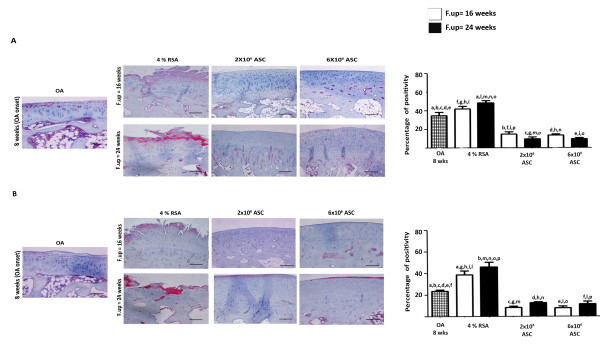
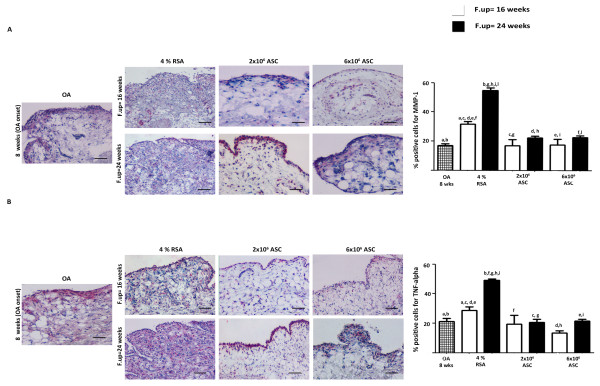
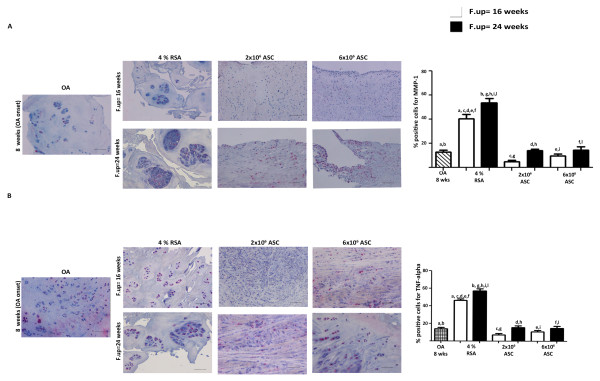
Methods: The induction of OA was performed surgically through bilateral anterior cruciate ligament transection (ACLT) to achieve eight weeks from ACLT a mild grade of OA. A total of 2×10⁶ and 6×10⁶ autologous ASCs isolated from inguinal fat, expanded in vitro and suspended in 4% rabbit serum albumin (RSA) were delivered in the hind limbs; 4% RSA was used as the control. Local bio-distribution of the cells was verified by injecting chloro-methyl-benzamido-1,1'-dioctadecyl-3,3,3'3'-tetra-methyl-indo-carbocyanine per-chlorate (CM-Dil) labeled ASCs in the hind limbs. Cartilage and synovial histological sections were scored by Laverty's scoring system to assess the severity of the pathology. Protein expression of some extracellular matrix molecules (collagen I and II), catabolic (metalloproteinase-1 and -3) and inflammatory (tumor necrosis factor- α) markers were detected by immunohistochemistry. Assessments were carried out at 16 and 24 weeks.

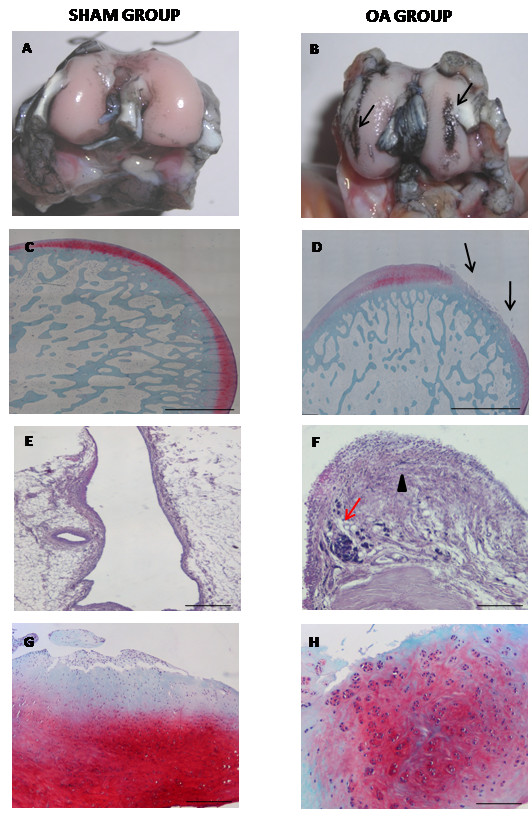
Results: Labeled-ASCs were detected unexpectedly in the synovial membrane and medial meniscus but not in cartilage tissue at 3 and 20 days from ASC-treatment. Intra-articular ASC administration decreases OA progression and exerts a healing contribution in the treated animals in comparison to OA and 4% RSA groups.

Conclusions: Our data reveal a healing capacity of ASCs in promoting cartilage and menisci repair and attenuating inflammatory events in synovial membrane inhibiting OA progression. On the basis of the local bio-distribution findings, the benefits obtained by ASC treatment could be due to a trophic mechanism of action by the release of growth factors and cytokines.


Figures

Figure 1
Figure 1
Degenerative changes in different articular compartments in sham and OA groups at eight weeks. (A, B) India ink staining of medial femoral condyle (MFC) of representative specimens. Arrows, fibrillation processes (C, D) Safranin-O/Fast Green staining of cartilage tissue of representative specimens. Arrows: Fibrillation and delamination processes. (E, F) Hematoxylin/Eosin staining of synovial membrane of representative specimens. Black arrows, Thickening of lining layer; Red arrows, Inflammatory cells. (G, H) Safranin-O/Fast Green staining of medial meniscus of representative specimens. Scale bars in C, D = 1 mm; E-H = 100 μm.
Figure 2
Figure 2
Chondrogenic and osteogenic differentiation of rabbit adipose stem cells (ASCs) in vitro. (A) Chondrogenic and osteogenic differentiation of rabbit ASCs labeled with CM-Dil in vitro. (B) Growth curves of unlabeled and labeled ASCs (C).
Figure 3
Figure 3
Biodistribution of CM-Dil labeled ASCs. Detection of labeled-ASCs in synovial lining layer (A-D) and medial meniscus (E-H) of representative specimens at 3 and 20 days from ASC administration under bright field (A, C, E, G) and epi-fluorescence (B, D, F, H). Blue staining = nuclei; Red staining = CM-Dil labeled-ASCs. Scale bars = 500 μm.
Figure 4
Figure 4
Quantitative assessment of disease progression in the different groups. (A) Fibrillation index. (B) Cartilage thickness. Data are reported in terms of mean ± SD. Statistical values of at least P < 0.01 were observed in all the comparisons.
Figure 5
Figure 5
Histological evaluation of medial femoral condyle in OA, 4% RSA and ASC-treated groups. (A) Safranin-O/Fast Green staining of representative specimens. Black arrows, fibrillation and delamination processes. Red arrows, Erosion processes. Scale bars = 1,000 μm. (B) Laverty's score. Data are reported in terms of 95% confidence intervals. Statistical values of at least P < 0.01 were observed in all the comparisons.
Figure 6
Figure 6
Histological evaluation of synovial membrane in OA, 4% RSA and ASC-treated groups. (A) H/E staining of representative specimens. Scale bars = 100 μm. (B) Laverty's score. Data are reported in terms of the 95% confidence intervals. Statistical values of at least P < 0.01 were observed in all the comparisons.
Figure 7
Figure 7
Histological evaluation of menisci in OA, 4% RSA and ASC-treated groups. (A) Safranin-O/Fast Green staining of representative specimens. Scale bars = 100 μm. (B) Numbers of cluster formation. All the data are reported as 95% confidence intervals. Statistical values of at least P < 0.01 were observed in all the comparisons.
Figure 8
Figure 8
Immunohistochemical analysis for collagen II and I in cartilage. Photomicrographs of representative specimens evaluated for type II (A) and I (B) collagens in medial femoral condyle of OA, 4% RSA and ASC-treated groups. Data are reported as mean ± SD. Scale bars = 100 μm. Statistical values of at least P < 0.01 were observed in all the comparisons.
Figure 9
Figure 9
Immunohistochemical analysis for MMP-1 and TNF-α in cartilage. Photomicrographs of representative specimens evaluated for MMP-1 (A) and TNF-α (B) in medial femoral condyle of OA, 4% RSA and ASC-treated groups. Data are reported as mean ± SD. Scale bars = 100 μm. Statistical values of at least P < 0.01 were observed in all the comparisons.
Figure 10
Figure 10
Immunohistochemical analysis for MMP-1 and TNF-α in synovial membrane. Photomicrographs of representative specimens evaluated for MMP-1 (A) and TNF-α (B) in synovial membrane of OA, 4% RSA and ASC-treated groups. Data are reported as mean ± SD. Scale bars = 100 μm. Statistical values of at least P < 0.01 were observed in all the comparisons.
Figure 11
Figure 11
Immunohistochemical analysis for MMP-1 and TNF-α in menisci. Photomicrographs of representative specimens evaluated for MMP-1 (A) and TNF-α (B) in medial menisci of OA, 4% RSA and ASC-treated groups. Data are reported as mean ± SD. Scale bars = 100 μm. Statistical values of at least P < 0.01 were observed in all the comparisons.

References

    1. Scott JC, Lethbridge-Cejku M, Hochberg MC. In: Osteoarthritis: Clinical and Experimental Aspects. 1. Reginster JY, Pelletier JP, Marte-Pelletier J, Henrotin Y, editor. Vol. 1. Munich, Germany: Springer; 1999. Epidemiology and economic consequences of osteoarthritis; pp. 20–52.
    1. Goldring MB, Goldring SR. Osteoarthritis. J Cell Physiol. 2007;213:626–634. doi: 10.1002/jcp.21258. - DOI - PubMed
    1. Loeser RF, Goldring SR, Scanzello CR, Goldring MB. Osteoarthritis: a disease of the joint as an organ. Arthritis Rheum. 2012;64:1697–1707. doi: 10.1002/art.34453. - DOI - PMC - PubMed
    1. Okada Y, Shinmei M, Tanaka O, Naka K, Kimura A, Nakanishi I, Bayliss MT, Iwata K, Nagase H. Localization of matrix metalloproteinase 3 (stromelysin) in osteoarthritic cartilage and synovium. Lab Invest. 1992;66:680–690. - PubMed
    1. Goldring SR, Goldring MB. The role of cytokines in cartilage matrix degeneration in osteoarthritis. Clin Orthop Relat Res. 2004;427(suppl):S27–S36. - PubMed

Publication types