

CaSR-mediated interactions between calcium and magnesium homeostasis in mice
- PMID: 23360827
- PMCID: PMC3625753
- DOI: 10.1152/ajpendo.00557.2012
CaSR-mediated interactions between calcium and magnesium homeostasis in mice
Abstract
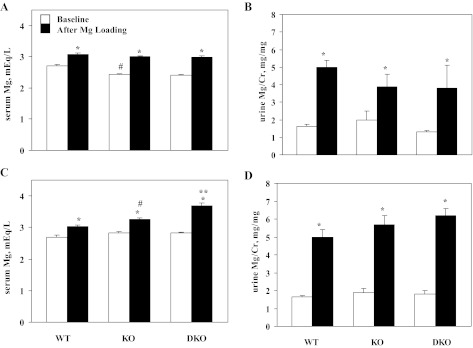
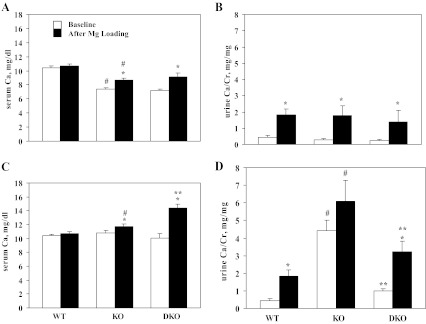
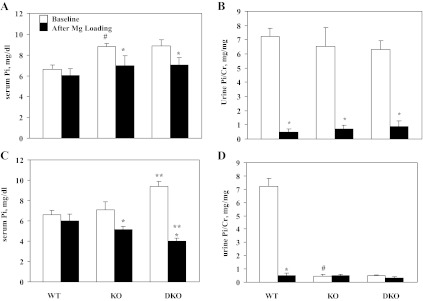
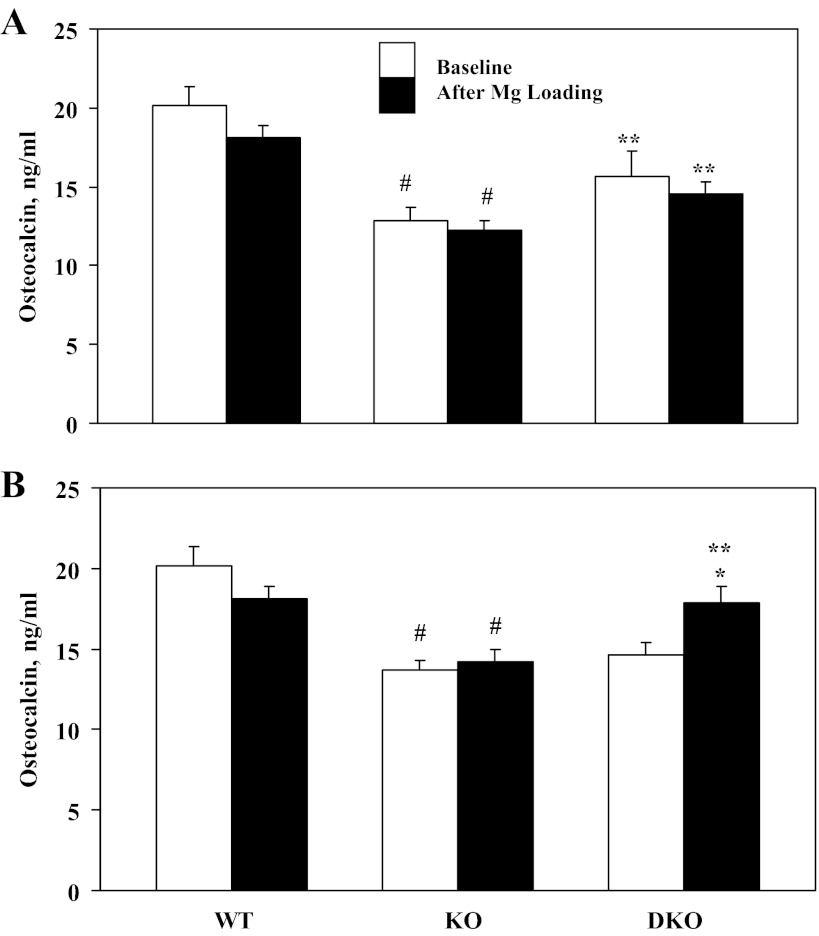
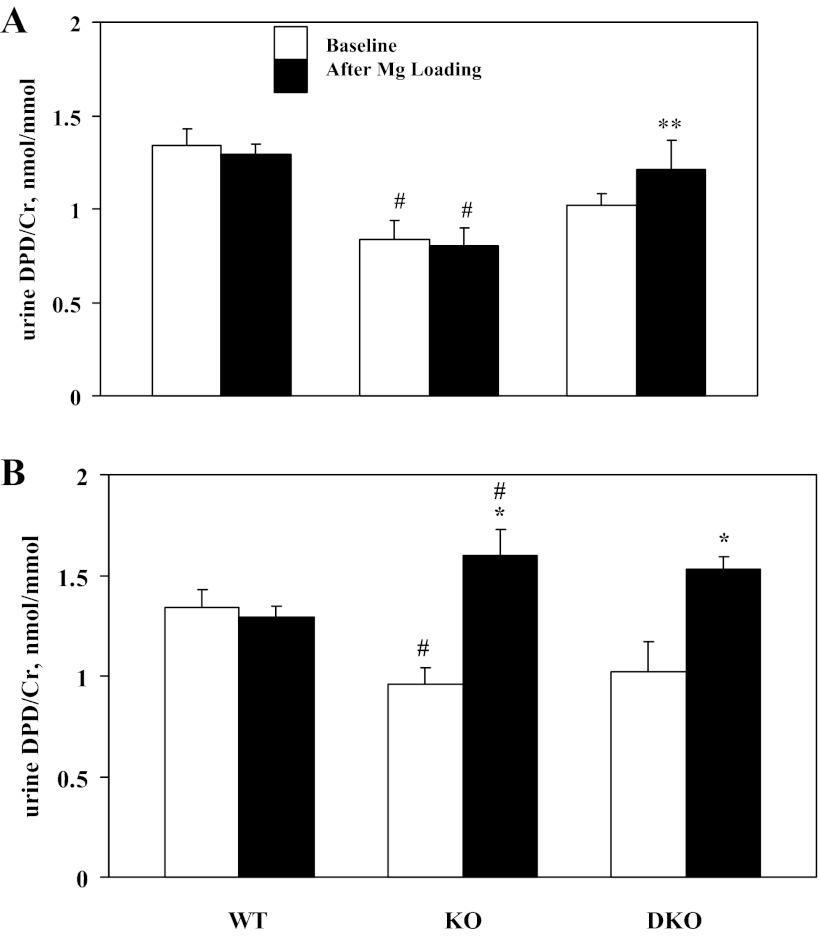
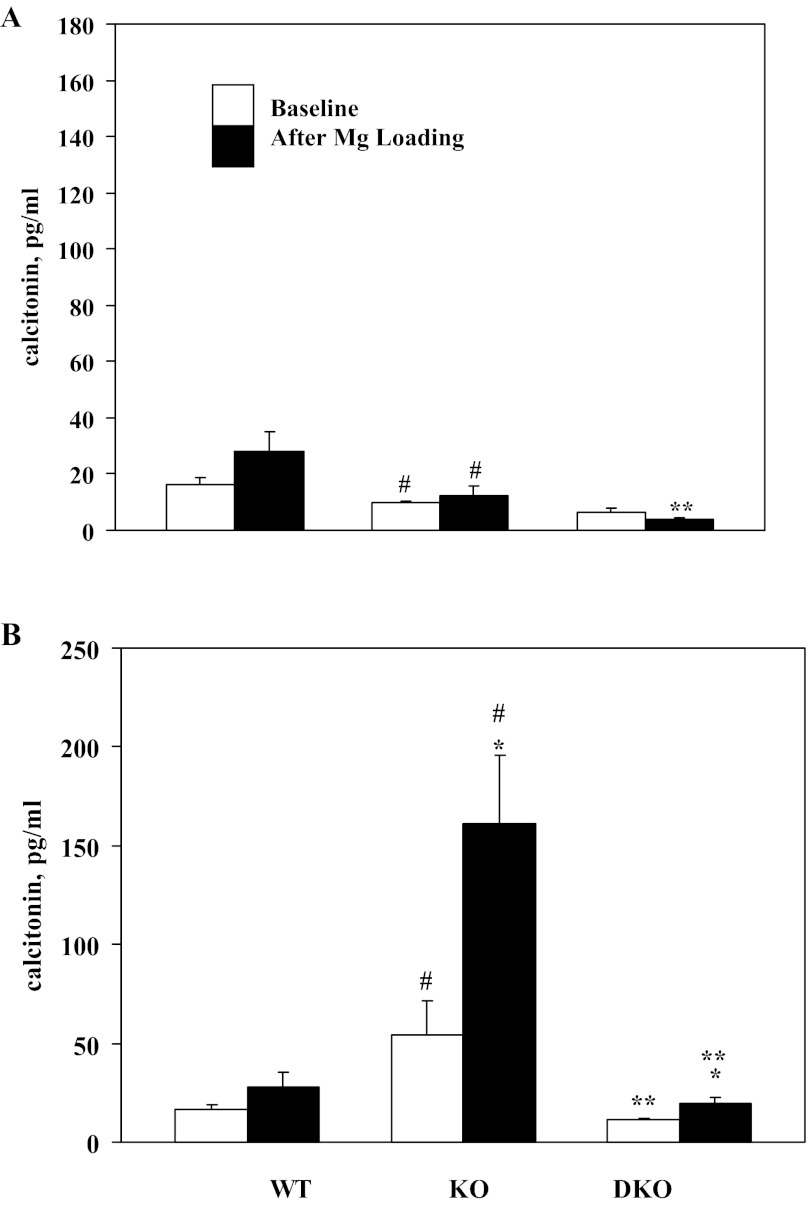
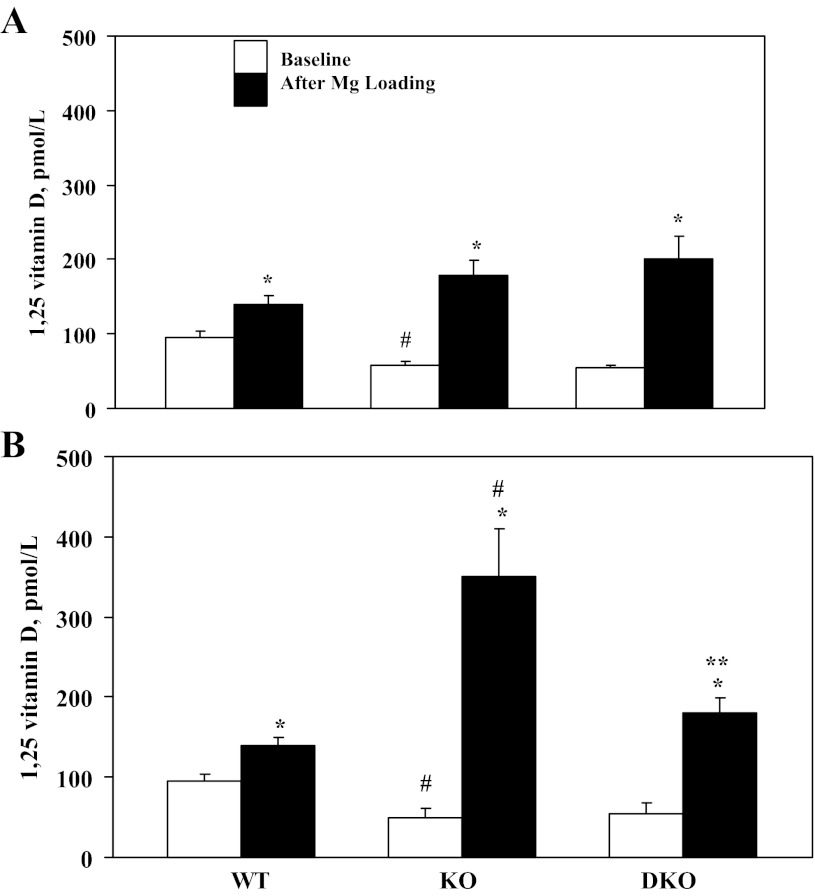
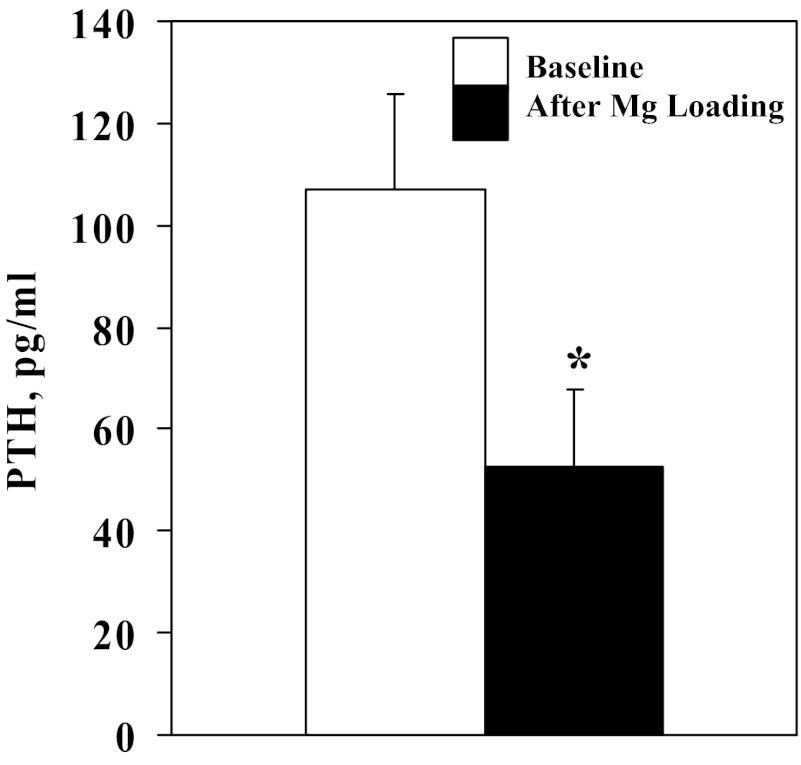
Calcium (Ca) and magnesium (Mg) homeostasis are interrelated and share common regulatory hormones, including parathyroid hormone (PTH) and vitamin D. However, the role of the calcium-sensing receptor (CaSR) in Mg homeostasis in vivo is not well understood. We sought to investigate the interactions between Mg and Ca homeostasis using genetic mouse models with targeted inactivation of PTH (PTH KO) or both PTH and the calcium-sensing receptor (CaSR) (double knockout, DKO). Serum Mg is lower in PTH KO and DKO mice than in WT mice on standard chow, whereas supplemental dietary Ca leads to equivalent Mg levels for all three genotypes. Mg loading increases serum Mg in all genotypes; however, the increase in serum Mg is most pronounced in the DKO mice. Serum Ca is increased with Mg loading in the PTH KO and DKO mice but not in the WT mice. Here, too, the hypercalcemia is much greater in the DKO mice. Serum and especially urinary phosphate are reduced during Mg loading, which is likely due to intestinal chelation of phosphate by Mg. Mg loading decreases serum PTH in WT mice and increases serum calcitonin in both WT and PTH KO mice but not DKO mice. Furthermore, Mg loading elevates serum 1,25-dihydroxyvitamin D in all genotypes, with greater effects in PTH KO and DKO mice, possibly due to reduced levels of serum phosphorus and FGF23. These hormonal responses to Mg loading and the CaSR's role in regulating renal function may help to explain changes in serum Mg and Ca found during Mg loading.
Figures
Similar articles
-
Interactions between calcium and phosphorus in the regulation of the production of fibroblast growth factor 23 in vivo.Am J Physiol Endocrinol Metab. 2013 Feb 1;304(3):E310-20. doi: 10.1152/ajpendo.00460.2012. Epub 2012 Dec 11. Am J Physiol Endocrinol Metab. 2013. PMID: 23233539 Free PMC article.
-
The calcium-sensing receptor (CaSR) defends against hypercalcemia independently of its regulation of parathyroid hormone secretion.Am J Physiol Endocrinol Metab. 2009 Oct;297(4):E915-23. doi: 10.1152/ajpendo.00315.2009. Am J Physiol Endocrinol Metab. 2009. PMID: 19797241 Free PMC article.
-
The full-length calcium-sensing receptor dampens the calcemic response to 1alpha,25(OH)2 vitamin D3 in vivo independently of parathyroid hormone.Am J Physiol Renal Physiol. 2009 Sep;297(3):F720-8. doi: 10.1152/ajprenal.00164.2009. Epub 2009 May 27. Am J Physiol Renal Physiol. 2009. PMID: 19474191 Free PMC article.
-
Physiology of the Calcium-Parathyroid Hormone-Vitamin D Axis.Front Horm Res. 2018;50:1-13. doi: 10.1159/000486060. Epub 2018 Mar 29. Front Horm Res. 2018. PMID: 29597231 Review.
-
Mechanistic homeostasis of vitamin D metabolism in the kidney through reciprocal modulation of Cyp27b1 and Cyp24a1 expression.J Steroid Biochem Mol Biol. 2020 Feb;196:105500. doi: 10.1016/j.jsbmb.2019.105500. Epub 2019 Oct 16. J Steroid Biochem Mol Biol. 2020. PMID: 31629064 Free PMC article. Review.
Cited by
-
Structural basis for regulation of human calcium-sensing receptor by magnesium ions and an unexpected tryptophan derivative co-agonist.Sci Adv. 2016 May 27;2(5):e1600241. doi: 10.1126/sciadv.1600241. eCollection 2016 May. Sci Adv. 2016. PMID: 27386547 Free PMC article.
-
Interactions of Phosphate Metabolism With Serious Injury, Including Burns.JBMR Plus. 2017 Jul 5;1(2):59-65. doi: 10.1002/jbm4.10011. eCollection 2017 Oct. JBMR Plus. 2017. PMID: 30283881 Free PMC article. Review.
-
Evaluation of 25(OH) Vitamin D3 with Reference to Magnesium Status and Insulin Resistance in T2DM.J Clin Diagn Res. 2013 Nov;7(11):2438-41. doi: 10.7860/JCDR/2013/6578.3568. Epub 2013 Oct 23. J Clin Diagn Res. 2013. PMID: 24392366 Free PMC article.
-
Replication of the Taste of Sugar by Formulation of Noncaloric Sweeteners with Mineral Salt Taste Modulator Compositions.J Agric Food Chem. 2023 Jun 21;71(24):9469-9480. doi: 10.1021/acs.jafc.3c01144. Epub 2023 Jun 7. J Agric Food Chem. 2023. PMID: 37283492 Free PMC article.
-
FGF-23 and secondary hyperparathyroidism in chronic kidney disease.Nat Rev Nephrol. 2013 Nov;9(11):641-9. doi: 10.1038/nrneph.2013.147. Epub 2013 Jul 23. Nat Rev Nephrol. 2013. PMID: 23877588 Review.
References
-
- Anast CS, Forte LF. Parathyroid function and magnesium depletion in the rat. Endocrinology 113: 184–189, 1983 - PubMed
-
- Ang AW, Ko SM, Tan CH. Calcium, magnesium, and psychotic symptoms in a girl with idiopathic hypoparathyroidism. Psychosom Med 57: 299–302, 1995 - PubMed
-
- Brown EM. Mechanisms regulating extracellular Ca homeostasis. In: Handbook of Parathyroid Diseases, edited by Khan A, Clark O. New York: Springer, 2012, p. 1–18
-
- Brown EM, Gamba G, Riccardi D, Lombardi M, Butters R, Kifor O, Sun A, Hediger MA, Lytton J, Hebert SC. Cloning and characterization of an extracellular Ca2+-sensing receptor from bovine parathyroid. Nature 366: 575–580, 1993 - PubMed
-
- Burnatowska MA, Harris CA, Sutton RA, Seely JF. Effects of vitamin D on renal handling of calcium, magnesium and phosphate in the hamster. Kidney Int 27: 864–870, 1985 - PubMed
Publication types
MeSH terms
Substances
Grants and funding
LinkOut - more resources
Full Text Sources
Other Literature Sources
Molecular Biology Databases
Research Materials