. 2013:4:1402.
doi: 10.1038/ncomms2409.

Caribbean-wide decline in carbonate production threatens coral reef growth

Affiliations
Free PMC article

Caribbean-wide decline in carbonate production threatens coral reef growth

Chris T Perry et al. Nat Commun. 2013.
Free PMC article

Abstract

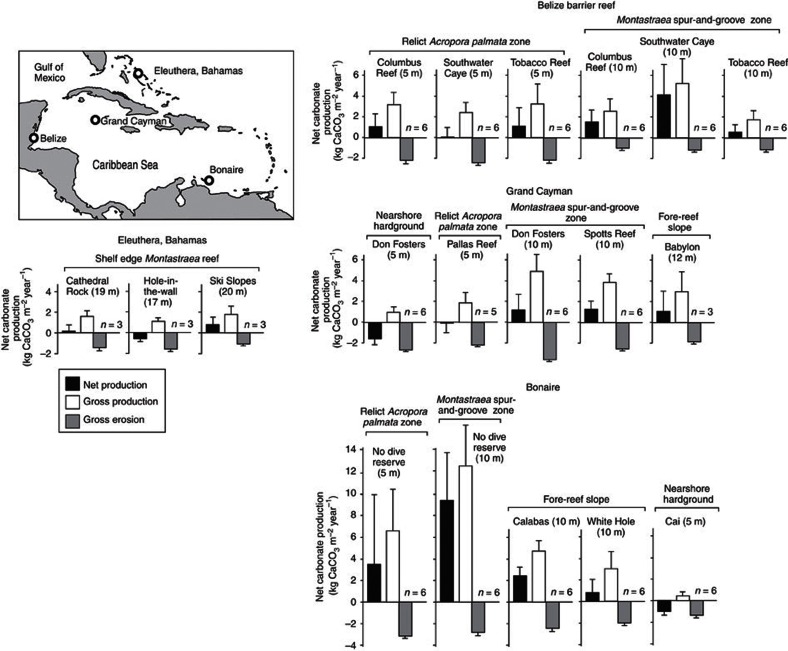
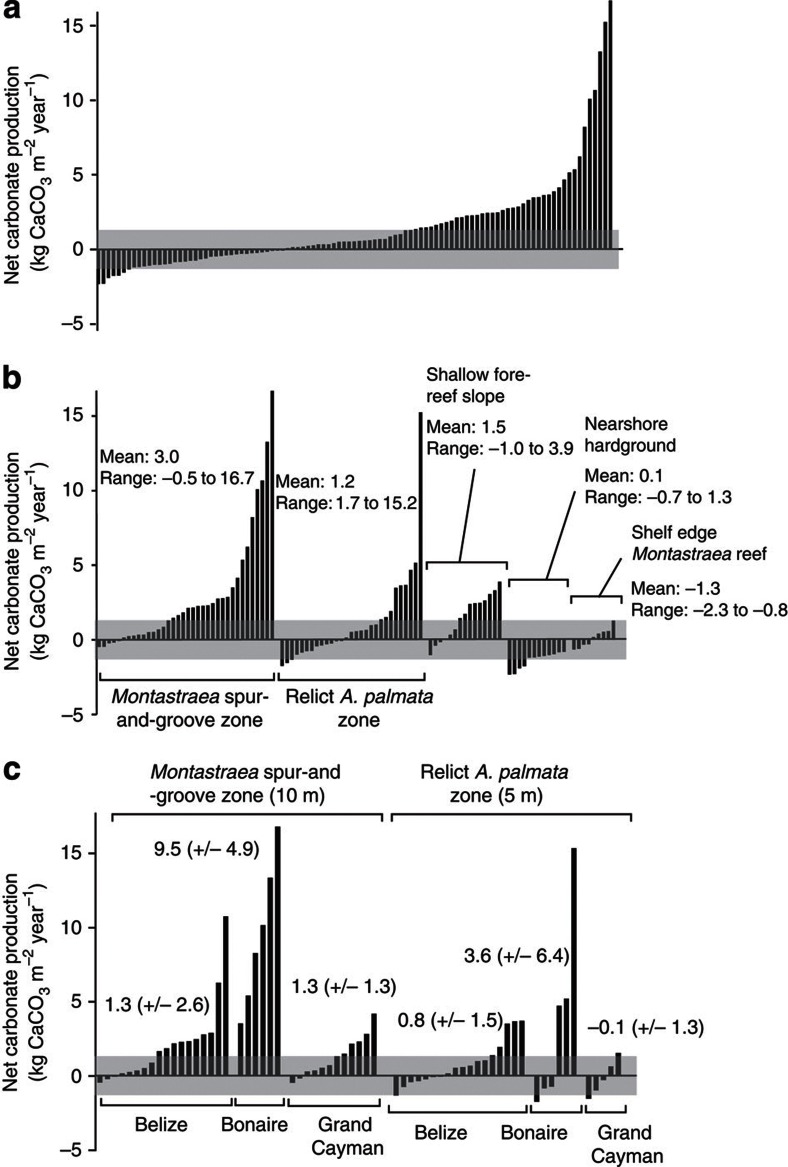
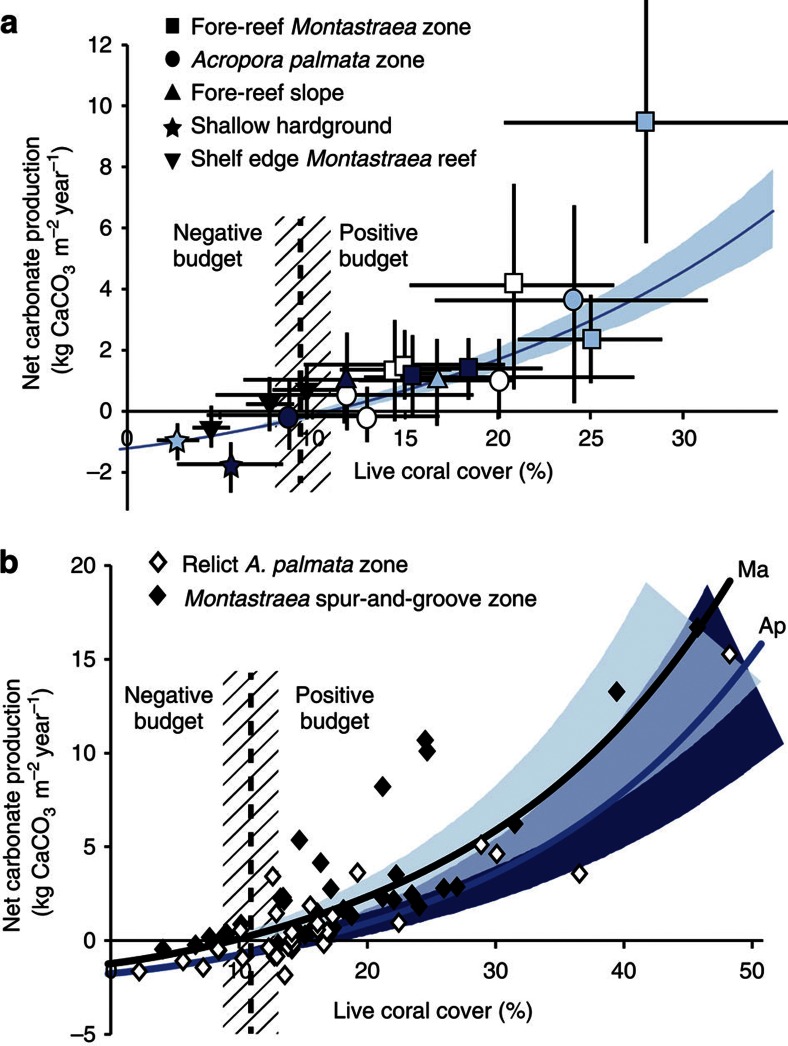
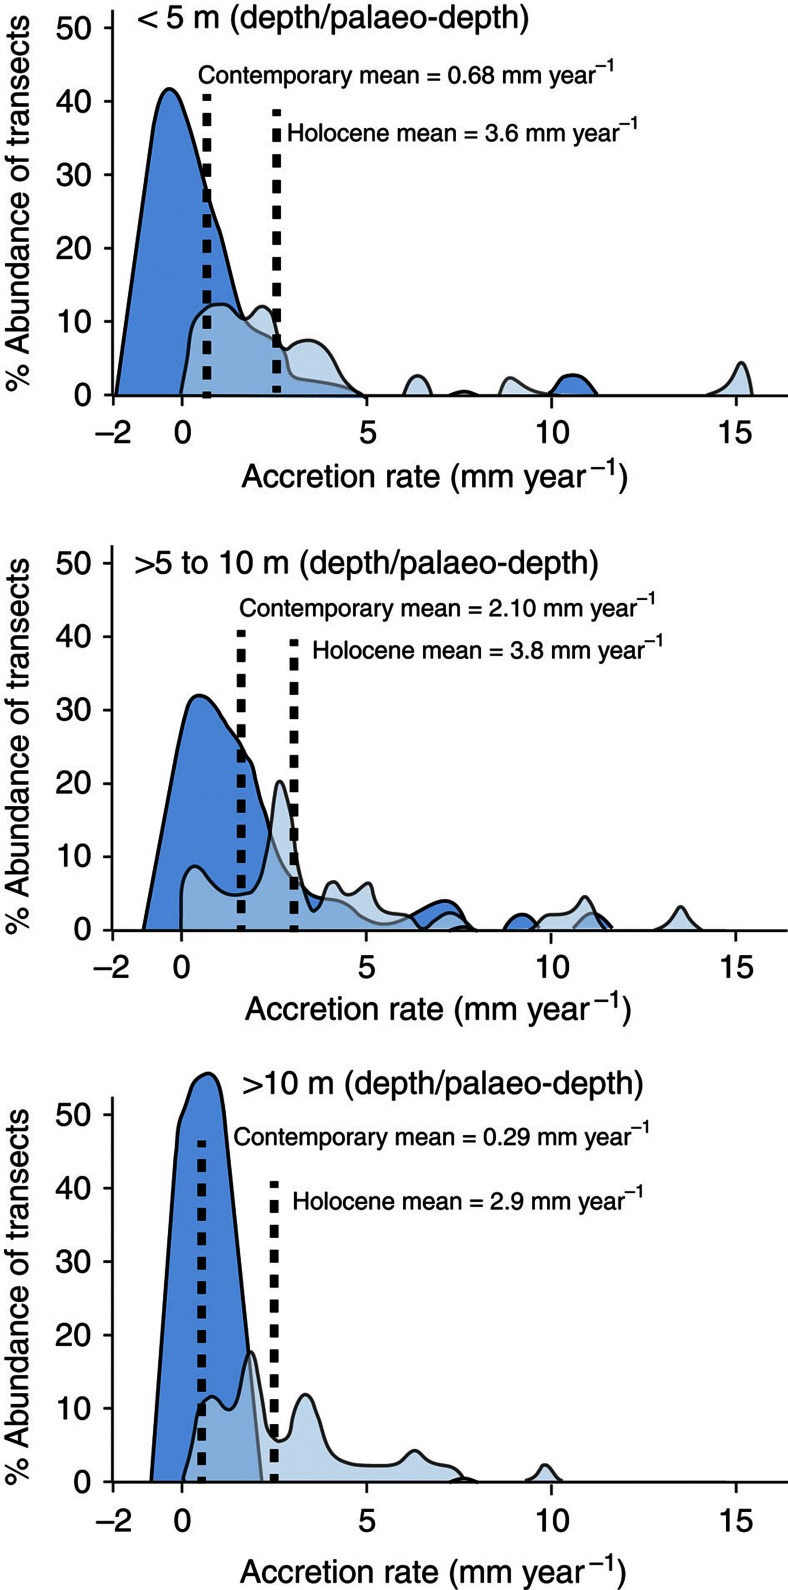
Global-scale deteriorations in coral reef health have caused major shifts in species composition. One projected consequence is a lowering of reef carbonate production rates, potentially impairing reef growth, compromising ecosystem functionality and ultimately leading to net reef erosion. Here, using measures of gross and net carbonate production and erosion from 19 Caribbean reefs, we show that contemporary carbonate production rates are now substantially below historical (mid- to late-Holocene) values. On average, current production rates are reduced by at least 50%, and 37% of surveyed sites were net erosional. Calculated accretion rates (mm year(-1)) for shallow fore-reef habitats are also close to an order of magnitude lower than Holocene averages. A live coral cover threshold of ~10% appears critical to maintaining positive production states. Below this ecological threshold carbonate budgets typically become net negative and threaten reef accretion. Collectively, these data suggest that recent ecological declines are now suppressing Caribbean reef growth potential.


Figures

Figure 1
Figure 1. Caribbean study sites and reef carbonate production rates.
Location of study sites across the Caribbean and plots showing gross carbonate production and erosion, and net production rates (kg CaCO3 m−2 year−1) for each study reef. Data are grouped by country. n=number of transects per reef site.
Figure 2
Figure 2. Trends in net reef carbonate production rates at the transect level across the Caribbean.
Plots showing trends in net carbonate production rates (kg CaCO3 m−2 year−1) measured at the transect level. (a) All data, all sites; (b) data pooled by habitat type; (c) data for the two main shallow water habitats pooled at the country level. Grey bands denote the critical transition zone (where budgets fall within the range ±1 kg CaCO3 m−2 year−1) and within which reef accretion is likely to either stall or move into net erosional states.
Figure 3
Figure 3. Relationships between live coral cover and carbonate production rates across the Caribbean.
Plots showing the relationships between live coral cover and carbonate production rates (kg CaCO3 m−2 year−1) at sites across the Caribbean. (a) Average net carbonate production against live coral cover for all 19 reefs delineated by habitat type. Black symbols—Bahamas, white symbols—Belize, light blue symbols—Bonaire, dark blue symbols—Grand Cayman. Vertical and horizontal bars are s.d. of data for each site. Best fit regression line and 95% confidence intervals shown in pale blue. (b) Net carbonate production against live coral cover at the transect level within the two major shallow water Caribbean reef habitats. Best fit regression line and 95% confidence intervals shown in dark blue for A. palmata reefs, and in pale blue for Montastraea spur-and-groove reefs. Vertical hatched bands denote the critical transition zone, around 10% live coral cover, below which reefs typically start to move into net erosion states.
Figure 4
Figure 4. Comparison of contemporary and Holocene reef accretion rates across the Caribbean.
Plots showing a comparison of depth-related patterns of contemporary and Holocene reef accretion (mm year−1) across the Caribbean. Contemporary accretion rates from sites in this study (dark blue plots) compared with those calculated for individual depositional horizons in Holocene reef cores (light blue plots) from sites across the Caribbean/Western Atlantic (data in ref. 23). Data are plotted as % abundance of core intervals/sites against measured accretion rate. Net negative rates are calculated for many of the modern sites implying conditions of net reef erosion.

References

    1. Moberg F. & Rönnbäck P.. Ecosystem services of the tropical seascape: interactions, substitutions and restoration. Ocean Coast. Manag. 46, 27–46 (2003) .
    1. Bellwood D. R., Hughes T. P., Folke C. & Nyström M.. Confronting the coral reef crisis. Nature 429, 827–833 (2004) . - PubMed
    1. Bruno J. F. & Selig E. R.. Regional decline of coral cover in the Indo-Pacific: timing, extent, and subregional comparisons. PLoS ONE 2, e711 (2007) . - PMC - PubMed
    1. Gardner T. A., Côté I. M., Gill J. A., Grant A. & Watkinson A. R.. Long-term region-wide declines in Caribbean corals. Science 301, 958–960 (2003) . - PubMed
    1. Alvarez-Filip L., Dulvy N. K., Gill J. A., Côté I. M. & Watkinson A. R.. Flattening of Caribbean coral reefs: region-wide declines in architectural complexity. Proc. R. Soc. B 276, 3019–3025 (2009) . - PMC - PubMed

Publication types